State rent research · editorial review 2026-10-24
Average Rent in Louisiana: ZIPs, Rental Readiness & Insurance
The median of 104 tracked Louisiana ZIP rent indices is $1,450 per month for September 2026.
Equal weight per ZIP · all homes and bedrooms combined · derived from Zillow’s smoothed asking-rent indices; this ZIP series is not seasonally adjusted. This is not a provider-published statewide estimate, an average paid by tenants or a rent quote for a particular home.
A Louisiana asking-rent benchmark cannot establish that a rental is ready to earn income or that its storm repair is insured. In New Orleans, renewed commercial sales activity is separate from small-rental collections and the buyer’s own Healthy Homes file. Coverage by peril can determine how much repair cost the owner ultimately bears.
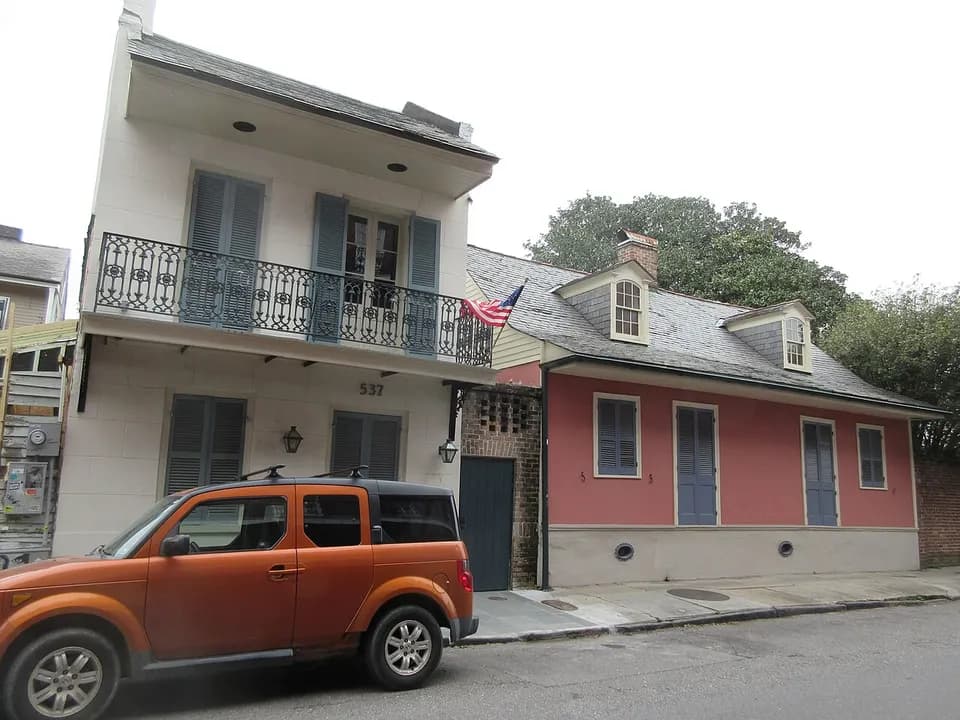
2019-03-18 · Infrogmation of New Orleans · Original photograph · CC BY-SA 4.0. Resized and converted to WebP.

What the rent evidence changes for a rental decision
Verify the property’s actual readiness, lease collections and rental-use policy before buying its advertised income. Obtain separate flood and named-storm terms and test the owner’s allocated repair cost once; statewide ZIP figures and sales volume cannot supply that protection.
Orleans and Jefferson commercial transactions
More capital changing hands is not a small rental’s rent growth
ELIFIN reports 48 multifamily sales totaling $193.4 million in the first half of 2026 across Orleans and Jefferson parishes. Its scope is commercial sales of at least $100,000 and multifamily buildings with at least five units. Volume includes estimated market values for undisclosed prices; the database was current July 31.
The evidence shows investment activity in that cohort, not improved tenant collections or a market price for a duplex. Large trades and estimated values can move dollar volume without establishing a rent increase at the subject.
Decision. Separate the subject’s size and location from the sales cohort. Inspect signed rents and deposits, current repair needs and buyer policy quotes before carrying a market-rent assumption into a purchase budget.
What could change it. Matching, disclosed sales with verified income can help test a purchase basis. Aggregate volume cannot replace those records, and a five-unit-plus cohort does not establish the value or leasing performance of one-to-three-unit homes.
Records to obtain. Comparable building size, disclosed transaction terms, actual rent roll, bank reconciliation, condition assessment and buyer operating quotes.
Read the source reports
- ELIFIN New Orleans commercial sales H1 2026 — First-half transactions in Orleans and Jefferson parishes; database current July 31, 2026, including late recording; $100,000+ commercial sales, multifamily 5+ units; public report read October 24, 2026.
New Orleans residential rental readiness
The seller’s certificate is not the buyer’s completed file
The city requires a Healthy Homes Certificate of Compliance to rent housing units. Its page lists June 15, 2025 for one-to-three-unit registration, accepts late applications, states certificates are nontransferable and gives transferred properties 90 days from sale to apply. Renewal is every two years.
The old phase-in deadline is not an upcoming 2026 grace period. A seller’s paperwork and a buyer’s application are different records. The transfer application period does not by itself prove the unit is habitable, the buyer file complete or rent immediately collectible.
Decision. Check the exact city jurisdiction, current registration and buyer transfer requirements with Healthy Homes. Resolve the property’s actual maintenance issues and obtain a dated completion and leasing plan before budgeting uninterrupted income.
What could change it. A documented, maintained rental may have little work to complete. Missing records, late registration or unresolved defects can create costs and delays. The program page is not evidence that a particular property has passed or that an application alone authorizes occupancy.
Records to obtain. Parcel/unit count, current certificate and expiration, sale date, buyer application, city correspondence and actual condition/repair records.
Read the source reports
- City of New Orleans · Healthy Homes Program — Current city program read October 24, 2026; 1–3-unit registration deadline June 15, 2025; ownership transfers and nontransferable certificates addressed separately.
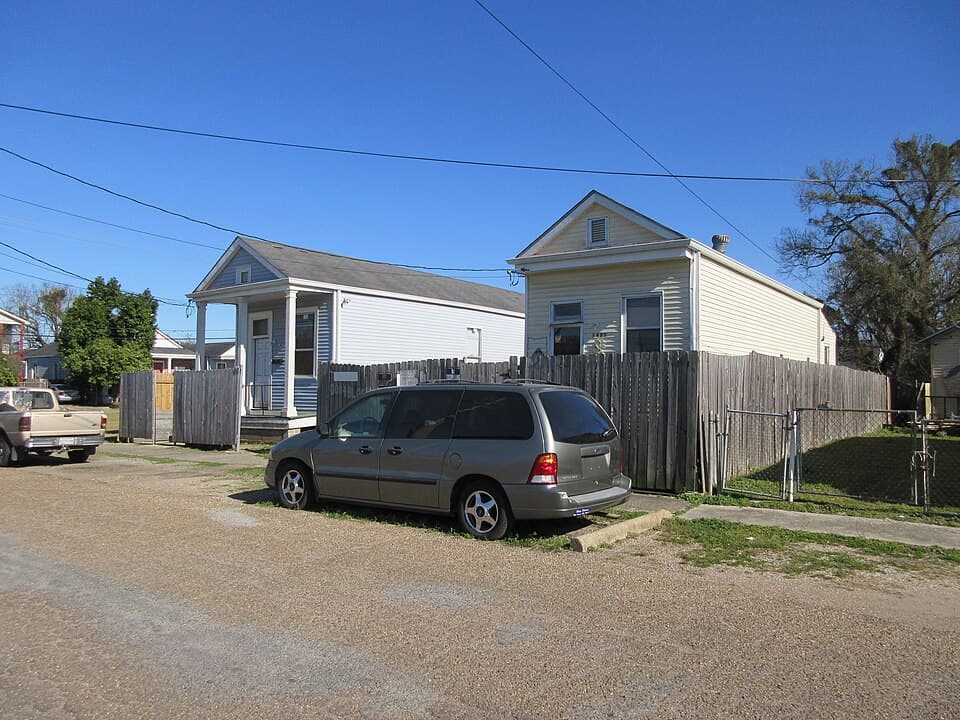
2016-02-19 · Infrogmation of New Orleans · Original photograph · CC BY 2.0. Wikimedia JPEG thumbnail used unchanged.

Louisiana rental-property insurance
The same repair price can leave three different owner costs
LDI illustrates named-storm deductibles as a percentage of insured property value, while its flood guidance explains that homeowners policies exclude flood and identifies separate flood coverage. Consumer guidance does not determine the terms of a rental or commercial contract.
A small percentage can still exceed annual operating cash, and a wind deductible does not create flood coverage. The comparison assumes one isolated $8,000 covered repair or an uncovered flood case, with stated deductibles, no limits problem and no other coverage adjustments.
Decision. Obtain declarations, covered perils, exclusions, rental-use endorsements, deductible bases and separate flood terms for the actual address. Have the insurer explain concurrent causes, limits and business-income treatment; do not count an expected repair reimbursement as rent.
What could change it. Verified broader coverage or a smaller loss can reduce owner cost; exclusions, limits, depreciation or multiple causes can increase it. These are alternative cases, not additive claims, probabilities, payment-timing estimates or quotes.
Records to obtain. Bound rental-use policy, declarations and endorsements, insured value, peril/deductible schedule, flood policy, repair estimate and insurer coverage determination.
Read the source reports
- Louisiana Department of Insurance · hurricane preparation and deductibles — Current public consumer guidance read October 24, 2026; actual rental/commercial policy terms must be checked; no premium or coverage quote.
- Louisiana Department of Insurance · flood insurance — Current primary flood coverage guidance read October 24, 2026; NFIP/private coverage distinguished from homeowners policies.
Hypothetical alternative cases · $250,000 insured building value · assumed 2% named-storm deductible or $2,000 separate flood deductible · coverage and full residual insurer payment assumed only in covered cases · no depreciation, limits issue or other adjustment
Same $8,000 repair · alternative policy/peril cases
Solid · owner cost · Hatched · assumed insurer share
Owner · $5,000 · Insurer · $3,000
Owner · $2,000 · Insurer · $6,000
Owner · $8,000 · Insurer · $0
Covered cases assume an applicable policy, full residual payment and no other adjustment. Compare eventual owner cost; the bands do not show payment timing, peak funding or event probabilities.
| Measure | Value | Definition |
|---|---|---|
| Covered named-storm case · owner | 5,000 | 2% × $250,000 = $5,000 owner cost; residual insurer share $3,000. |
| Covered separate-flood case · owner | 2,000 | $2,000 assumed deductible; residual insurer share $6,000. |
| No applicable flood coverage · owner | 8,000 | Owner bears all $8,000; insurer share $0. |
| Difference: uncovered vs covered flood owner cost | 6,000 | $8,000 − $2,000 = $6,000; a comparison of alternatives, not another expense. |
The 2% applies to insured value, not the $8,000 invoice: $160 would be the wrong deductible in this assumed case. The bands show eventual cost allocation, not peak cash needed or payment timing. After the worksheet’s $1,240 annual reference cash, these separate owner costs leave −$3,760, −$760 or −$6,760. Deduct the owner share once, not the full repair plus that share.
Read the source reports
- Louisiana Department of Insurance · hurricane preparation and deductibles — Current public consumer guidance read October 24, 2026; actual rental/commercial policy terms must be checked; no premium or coverage quote.
- Louisiana Department of Insurance · flood insurance — Current primary flood coverage guidance read October 24, 2026; NFIP/private coverage distinguished from homeowners policies.
Compare rents across these county groups
These are named parish sets represented by current ZIP observations, not complete metro definitions. New Orleans transaction and municipal-program evidence below does not describe Baton Rouge, Lafayette or the rest of Louisiana. Source parish labels are retained exactly, including Saint spellings.
These analyst-selected sets use the listed county labels and the same September 2026 observation month. Each ZIP receives one equal vote. They are not official metro definitions, exhaustive regions or bedroom comparisons.
21 distinct county labels appear in the current sample; geographic coverage is incomplete and uneven. Only currently available observations from the same latest month enter these comparisons. Older retained records and missing ZIPs do not enter as zero rents.
| Comparison and exact membership | ZIP median | ZIP count |
|---|---|---|
| Orleans / Jefferson parish set Orleans Parish, Jefferson Parish | $1,604 | 29 |
| Northshore parish set Saint Tammany Parish, Tangipahoa Parish | $1,501 | 10 |
| Baton Rouge-area parish set East Baton Rouge Parish, West Baton Rouge Parish, Ascension Parish, Livingston Parish | $1,380 | 21 |
| Lafayette / Iberia parish set Lafayette Parish, Iberia Parish | $1,379 | 10 |
| Shreveport / Bossier parish set Caddo Parish, Bossier Parish | $1,245 | 12 |
| Lake Charles-area parish set Calcasieu Parish, Beauregard Parish | $1,224 | 7 |
Compare supported postal-city groups
City links require at least three current ZIP observations. Postal city labels are not legal municipal boundaries. Groups are ordered by coverage, then name; this is not an affordability ranking.
7 matching cities
| Postal city | ZIP median / month | ZIP mean / month | ZIP count |
|---|---|---|---|
| New Orleans | $1,675 | $1,679 | 15 |
| Baton Rouge | $1,310 | $1,257 | 13 |
| Shreveport | $997 | $1,075 | 8 |
| Lafayette | $1,314 | $1,327 | 5 |
| Metairie | $1,445 | $1,517 | 5 |
| Lake Charles | $1,274 | $1,256 | 4 |
| Slidell | $1,476 | $1,543 | 3 |
Find a ZIP rent observation
The table preserves each source ZIP, date and supplied county label. A ZIP can cross county or municipal boundaries; verify the actual address separately. No bedroom multiplier is applied.
104 matching ZIPs
| ZIP | Postal city | County label | Index / month | Observation |
|---|---|---|---|---|
| 70001 | Metairie | Jefferson Parish | $1,445 | September 2026 |
| 70002 | Metairie | Jefferson Parish | $1,264 | September 2026 |
| 70003 | Metairie | Jefferson Parish | $1,429 | September 2026 |
| 70005 | Metairie | Jefferson Parish | $1,690 | September 2026 |
| 70006 | Metairie | Jefferson Parish | $1,757 | September 2026 |
| 70032 | Arabi | Saint Bernard Parish | $1,338 | September 2026 |
| 70043 | Chalmette | Saint Bernard Parish | $1,404 | September 2026 |
| 70047 | Destrehan | Saint Charles Parish | $1,499 | September 2026 |
| 70053 | Gretna | Jefferson Parish | $1,623 | September 2026 |
| 70056 | Gretna | Jefferson Parish | $1,498 | September 2026 |
Show 94 more ZIP observations
| ZIP | Postal city | County label | Index / month | Observation |
|---|---|---|---|---|
| 70058 | Harvey | Jefferson Parish | $1,285 | September 2026 |
| 70062 | Kenner | Jefferson Parish | $1,425 | September 2026 |
| 70065 | Kenner | Jefferson Parish | $1,639 | September 2026 |
| 70070 | Luling | Saint Charles Parish | $1,723 | September 2026 |
| 70072 | Marrero | Jefferson Parish | $1,683 | September 2026 |
| 70094 | Westwego | Jefferson Parish | $1,535 | September 2026 |
| 70112 | New Orleans | Orleans Parish | $1,739 | September 2026 |
| 70113 | New Orleans | Orleans Parish | $2,486 | September 2026 |
| 70114 | New Orleans | Orleans Parish | $1,458 | September 2026 |
| 70115 | New Orleans | Orleans Parish | $1,679 | September 2026 |
| 70116 | New Orleans | Orleans Parish | $1,675 | September 2026 |
| 70117 | New Orleans | Orleans Parish | $1,502 | September 2026 |
| 70118 | New Orleans | Orleans Parish | $1,807 | September 2026 |
| 70119 | New Orleans | Orleans Parish | $1,545 | September 2026 |
| 70121 | Jefferson | Jefferson Parish | $1,606 | September 2026 |
| 70122 | New Orleans | Orleans Parish | $1,475 | September 2026 |
| 70123 | River Ridge | Jefferson Parish | $1,540 | September 2026 |
| 70124 | New Orleans | Orleans Parish | $1,859 | September 2026 |
| 70125 | New Orleans | Orleans Parish | $1,691 | September 2026 |
| 70126 | New Orleans | Orleans Parish | $1,604 | September 2026 |
| 70127 | New Orleans | Orleans Parish | $1,414 | September 2026 |
| 70130 | New Orleans | Orleans Parish | $1,794 | September 2026 |
| 70131 | New Orleans | Orleans Parish | $1,463 | September 2026 |
| 70301 | Thibodaux | Lafourche Parish | $1,226 | September 2026 |
| 70360 | Houma | Terrebonne Parish | $1,354 | September 2026 |
| 70364 | Houma | Terrebonne Parish | $1,248 | September 2026 |
| 70401 | Hammond | Tangipahoa Parish | $1,149 | September 2026 |
| 70403 | Hammond | Tangipahoa Parish | $1,378 | September 2026 |
| 70433 | Covington | Saint Tammany Parish | $1,526 | September 2026 |
| 70447 | Madisonville | Saint Tammany Parish | $2,500 | September 2026 |
| 70448 | Mandeville | Saint Tammany Parish | $1,855 | September 2026 |
| 70454 | Ponchatoula | Tangipahoa Parish | $1,610 | September 2026 |
| 70458 | Slidell | Saint Tammany Parish | $1,474 | September 2026 |
| 70460 | Slidell | Saint Tammany Parish | $1,679 | September 2026 |
| 70461 | Slidell | Saint Tammany Parish | $1,476 | September 2026 |
| 70471 | Mandeville | Saint Tammany Parish | $1,407 | September 2026 |
| 70501 | Lafayette | Lafayette Parish | $1,078 | September 2026 |
| 70503 | Lafayette | Lafayette Parish | $1,314 | September 2026 |
| 70506 | Lafayette | Lafayette Parish | $1,312 | September 2026 |
| 70507 | Lafayette | Lafayette Parish | $1,487 | September 2026 |
| 70508 | Lafayette | Lafayette Parish | $1,443 | September 2026 |
| 70518 | Broussard | Lafayette Parish | $1,650 | September 2026 |
| 70520 | Carencro | Lafayette Parish | $1,516 | September 2026 |
| 70529 | Duson | Lafayette Parish | $838 | September 2026 |
| 70560 | New Iberia | Iberia Parish | $1,312 | September 2026 |
| 70592 | Youngsville | Lafayette Parish | $1,787 | September 2026 |
| 70601 | Lake Charles | Calcasieu Parish | $1,039 | September 2026 |
| 70605 | Lake Charles | Calcasieu Parish | $1,438 | September 2026 |
| 70607 | Lake Charles | Calcasieu Parish | $1,367 | September 2026 |
| 70611 | Lake Charles | Calcasieu Parish | $1,181 | September 2026 |
| 70634 | Deridder | Beauregard Parish | $1,224 | September 2026 |
| 70663 | Sulphur | Calcasieu Parish | $1,124 | September 2026 |
| 70669 | Westlake | Calcasieu Parish | $1,965 | September 2026 |
| 70706 | Denham Springs | Livingston Parish | $1,648 | September 2026 |
| 70710 | Addis | West Baton Rouge Parish | $1,720 | September 2026 |
| 70714 | Baker | East Baton Rouge Parish | $1,212 | September 2026 |
| 70726 | Denham Springs | Livingston Parish | $1,507 | September 2026 |
| 70737 | Gonzales | Ascension Parish | $1,527 | September 2026 |
| 70767 | Port Allen | West Baton Rouge Parish | $1,850 | September 2026 |
| 70769 | Prairieville | Ascension Parish | $2,074 | September 2026 |
| 70791 | Zachary | East Baton Rouge Parish | $1,694 | September 2026 |
| 70802 | Baton Rouge | East Baton Rouge Parish | $1,088 | September 2026 |
| 70805 | Baton Rouge | East Baton Rouge Parish | $925 | September 2026 |
| 70806 | Baton Rouge | East Baton Rouge Parish | $1,310 | September 2026 |
| 70808 | Baton Rouge | East Baton Rouge Parish | $1,466 | September 2026 |
| 70809 | Baton Rouge | East Baton Rouge Parish | $1,380 | September 2026 |
| 70810 | Baton Rouge | East Baton Rouge Parish | $1,540 | September 2026 |
| 70811 | Baton Rouge | East Baton Rouge Parish | $1,199 | September 2026 |
| 70812 | Baton Rouge | East Baton Rouge Parish | $1,225 | September 2026 |
| 70815 | Baton Rouge | East Baton Rouge Parish | $931 | September 2026 |
| 70816 | Baton Rouge | East Baton Rouge Parish | $1,055 | September 2026 |
| 70817 | Baton Rouge | East Baton Rouge Parish | $1,526 | September 2026 |
| 70820 | Baton Rouge | East Baton Rouge Parish | $1,328 | September 2026 |
| 70836 | Baton Rouge | East Baton Rouge Parish | $1,373 | September 2026 |
| 71037 | Haughton | Bossier Parish | $2,129 | September 2026 |
| 71101 | Shreveport | Caddo Parish | $986 | September 2026 |
| 71104 | Shreveport | Caddo Parish | $1,007 | September 2026 |
| 71105 | Shreveport | Caddo Parish | $1,264 | September 2026 |
| 71106 | Shreveport | Caddo Parish | $980 | September 2026 |
| 71107 | Shreveport | Caddo Parish | $1,381 | September 2026 |
| 71108 | Shreveport | Caddo Parish | $912 | September 2026 |
| 71109 | Shreveport | Caddo Parish | $846 | September 2026 |
| 71111 | Bossier City | Bossier Parish | $1,530 | September 2026 |
| 71112 | Bossier City | Bossier Parish | $1,551 | September 2026 |
| 71115 | Elm Grove | Caddo Parish | $1,454 | September 2026 |
| 71118 | Shreveport | Caddo Parish | $1,225 | September 2026 |
| 71201 | Monroe | Ouachita Parish | $1,508 | September 2026 |
| 71203 | Monroe | Ouachita Parish | $1,323 | September 2026 |
| 71270 | Ruston | Lincoln Parish | $1,187 | September 2026 |
| 71291 | West Monroe | Ouachita Parish | $1,267 | September 2026 |
| 71292 | West Monroe | Ouachita Parish | $921 | September 2026 |
| 71301 | Alexandria | Rapides Parish | $786 | September 2026 |
| 71303 | Alexandria | Rapides Parish | $1,363 | September 2026 |
| 71360 | Pineville | Rapides Parish | $948 | September 2026 |
Can annual cash absorb the owner’s uninsured repair share?
Hypothetical unit: $1,600 rent, 5% vacancy/noncollection, no free month, $8,000 operating expenses including assumed annual insurance premiums, $8,000 debt and $1,000 replacement reserve. The separate illustrated event repair is excluded from recurring expenses. No premium, policy or rent quote is implied; acquisition cash, initial work and taxes on income are separate.
Initial calculated result: $18,240 collected rent, $10,240 NOI before debt/reserves, and $1,240 cash after debt/reserves. Change the assumptions below to test your own budget.
Illustration · one apartment · first 12 months · USD. Editable assumptions, not observed market averages or an acquisition recommendation. All recurring amounts are allocated per apartment. No appreciation, sale proceeds or tax benefits are assumed.
Annual cash after operating costs, debt and reserve contribution
$1,240This is a positive illustration margin, before initial capital work, income tax and sale costs.
- Scheduled rent
- $19,200
- − Vacancy / noncollection
- -$960
- − Occupied-share concession
- -$0
- = Effective rental income
- $18,240
- − Operating expenses
- -$8,000
- = NOI before debt / reserves
- $10,240
- − Debt service
- -$8,000
- − Reserve contribution
- -$1,000
- = Annual cash margin
- $1,240
NOI excludes debt service and this worksheet’s reserve contribution. Initial renovation, acquisition costs and initial downtime are outside this annual operating illustration. Do not subtract the same vacancy, incentive or repair expense twice.
On a narrow screen, scroll the table sideways to compare all three expense budgets.
| Collected occupancy | Entered expenses | Expenses +10% | Expenses +20% |
|---|---|---|---|
| 95% | $1,240Cash remaining | $440Cash remaining | -$360Cash deficit |
| 90% | $280Cash remaining | -$520Cash deficit | -$1,320Cash deficit |
| 85% | -$680Cash deficit | -$1,480Cash deficit | -$2,280Cash deficit |
Occupancy here is the collected share of scheduled rent before incentives, not a count of occupied doors. At the entered costs, break-even collected occupancy is 88.5%. Debt-service coverage is 1.28× NOI / debt service; it excludes reserve contributions.
Reference annual cash is $1,240. One additional occupied-share month without rent removes $1,520 and leaves −$280 before any separate event cost. Adding the assumed $5,000 owner share once leaves −$5,280. Reserves are already below NOI in this budget; an existing reserve balance would be a separate funding source, not new rent or profit.
Use the full property cash-flow calculator for the purchase price, financing terms and holding period. Review its expense and reserve conventions before transferring assumptions; this illustration does not automatically populate a deal.
Louisiana rent questions
Is this Louisiana’s one-bedroom paid rent?
No. These are same-month all-home/all-bedroom ZIP asking-rent indices, smoothed and not seasonally adjusted. The summary weights each covered ZIP equally and is not a household-weighted average or provider-published state ZORI.
Does New Orleans evidence apply to Baton Rouge or Lafayette?
No. Use the separate city and parish ZIP comparisons and collect local evidence. The transaction study covers Orleans and Jefferson; the Healthy Homes discussion concerns New Orleans.
Is a 2% named-storm deductible 2% of the repair invoice?
In this illustration it is 2% of the $250,000 insured value, or $5,000. Verify the actual policy’s base, peril, terms and exclusions. This example does not quote a rental policy.
Should I deduct the repair and owner deductible twice?
No. The figure allocates one repair between owner and insurer in alternative cases. Apply the owner share once for the eventual cost comparison; actual funding and claim-payment timing require a separate cash plan.
How these rent figures are calculated
State: Louisiana · USPS LA · Census state FIPS 22. Zillow supplies postal ZIP observations with city and county labels. We filter to valid positive rents in this state and the latest common observation month, sort the values, and take the middle value, or the mean of the two middle values for an even count. Means are the sum divided by included ZIPs. No population, household or rental-unit weighting is added.
The all-home, all-bedroom ZIP series is smoothed, not seasonally adjusted. A bedroom rent cannot be inferred from it. Membership can change after a refresh, so a change in this page’s median is not a matched-sample rent-growth rate. This edition does not publish a ZIP-sample growth claim.
Data: Zillow Research · ZORI method · National ZIP source CSV. The state benchmark is our ZIP-based calculation, not a provider-published statewide estimate. Occupied-unit Census rent, listing medians, effective broker rents and HUD gross-rent references answer different questions and are not blended here.
The observation month identifies the rent data available for this comparison. Historical or missing latest observations stay out of the current sample. Check the date before comparing a property with a newly advertised offer.
Market and legal sources below were reviewed 2026-10-24. Their own periods are shown next to each claim. Broker samples and boundaries are not fully disclosed; surveys may share underlying providers and should not be treated as independent experiments. The market interpretation is conditional research, not a property-level income guarantee. Recheck local rules, signed comparable leases and actual expenses before using an illustration in a transaction.
Read the source reports
- ELIFIN New Orleans commercial sales H1 2026 — First-half transactions in Orleans and Jefferson parishes; database current July 31, 2026, including late recording; $100,000+ commercial sales, multifamily 5+ units; public report read October 24, 2026.
- City of New Orleans · Healthy Homes Program — Current city program read October 24, 2026; 1–3-unit registration deadline June 15, 2025; ownership transfers and nontransferable certificates addressed separately.
- Louisiana Department of Insurance · hurricane preparation and deductibles — Current public consumer guidance read October 24, 2026; actual rental/commercial policy terms must be checked; no premium or coverage quote.
- Louisiana Department of Insurance · flood insurance — Current primary flood coverage guidance read October 24, 2026; NFIP/private coverage distinguished from homeowners policies.