

Maryland cap evidence: what can actually be compared
Marcus & Millichap reports a 6.5% average apartment cap for Baltimore in its Q2 2026 report, with sales measured through the first quarter. Its metro and transaction cohort do not establish a Maryland statewide rate. Suburban rental performance, downtown sale composition and the Washington-area regulatory boundary require separate underwriting.
“Baltimore’s multifamily fundamentals are showing signs of improvement in 2026.”
Harbor Stone — August Baltimore snapshot. The August publisher interpretation; newer-community concessions remain part of that same account.
A capitalization rate is annual net operating income divided by property price, before debt. A published cap metric helps select comparables; it cannot establish the subject property’s income or condition.
Dated evidence, not a statewide average
Original display. The numeric scale starts at zero and ends at 10%. Historical, asking and transaction observations retain their labels; missing data is not zero.
| Geography / asset | Period | Reported cap | Basis and limits |
|---|---|---|---|
| Baltimore metro apartment average | Through Q1 2026; Q2 report | 6.50% | Publisher-reported average cap. Sales research generally covers $1m+ transactions; cap-reporting subset, weighting and NOI basis undisclosed. |
| Montgomery and Prince George’s counties | October 2026 review | Not verified | No matched current county apartment cap verified. Washington metro evidence cannot isolate a Maryland county or a rent-regulated subject. |
| Frederick, Western Maryland and Eastern Shore | October 2026 review | Not verified | Coverage gap. Baltimore is not a matched cap benchmark for these local buyer pools. |
The Baltimore average combines a sale cohort, not a standardized building. The report identifies portfolio and bankruptcy-related downtown activity; an increase in transactions is not proof that all properties have recovered. Keep the average cap distinct from any proposed renovation yield and from modeled county rent-to-price screens.
One percentage point = 100 basis points. Multiple publishers sharing a dataset do not create independent confirmation. Asking caps, reported-sale medians, averages and modeled county indexes must remain distinct.
The local decisions behind the cap rate
| Market / measure | Period | Value | Boundary |
|---|---|---|---|
| Downtown Baltimore vacancy | March 2026 | 6.5% | Operating vacancy, not the cap rate despite the same number. |
| Parkville–Carney–Perry Hall, Ellicott City–Elkridge and Baltimore City North vacancy | March 2026 | Around 4% | Approximate publisher submarket operating references; no neighborhood cap inferred. |
| Baltimore metro construction | August 2026 snapshot | More than 2,800 units underway | CoStar / Harbor Stone; not the same period as March operations. |
| Recently delivered communities offering incentives | August 2026 / Q3 to date | Approximately half of communities delivered since 2024 | Property share, not percentage of units or rent; incentives vary. |
Downtown Baltimore: trading recovery can contain distress
Observed evidence and boundary. The Q2 report identifies increased downtown transaction activity, including portfolios and bankruptcy-related sales. Downtown operating vacancy was higher than in selected outer submarkets in March.
A workout can clear at a low purchase basis while leaving lease-up, legal-use or capital obligations for the buyer. Portfolio allocations also obscure what an individual property would command. Count transactions and comparable financeable income separately. A low per-unit price may be useful only after the acquired obligations are priced.
Direction. Editorial interpretation: treat stabilization as a property test, not a consequence of more deals. Compression requires evidence that a buyer can finance durable income at a higher multiple after necessary work.
What would change the view. A wider set of ordinary arm’s-length stabilized closings would reduce the composition concern. Repeated sales with incomplete capital plans or persistent incentives would keep the headline recovery tentative.
Before underwriting. Request the sale terms, any portfolio allocation, audited collections and a funded repair scope. Build monthly carry for work units and concessions. Do not apply an average extracted from a different cohort to justify a downtown renovation price.
Evidence: Marcus & Millichap — Baltimore Q2 report, pp. 1–2. Retrieved October 19, 2026. Interpretations and property decisions are RentalCalcs analysis.
Parkville, Ellicott City and the outer belt: occupancy is not the complete return
Observed evidence and boundary. Marcus & Millichap’s March operating references put several outer submarkets around 4% vacancy. That evidence concerns leasing, not a separate local cap grid.
A stabilized garden property may have less competing new product but still carry expensive mechanical systems, drainage, roofing or owner-paid utilities. An apparently safe rent roll should therefore be tested against both property condition and the actual buyer tax and coverage budget.
Direction. Editorial interpretation: steadier occupancy can support income durability, but it does not establish the premium a buyer should pay. Avoid using physical occupancy alone to reduce the cap or replacement reserves.
What would change the view. Low delinquency and renewal collections after fully priced maintenance would support stability. Hidden concessions, large utility increases or unquoted systems work would weaken the case even if units remain occupied.
Before underwriting. Reconcile lease charges with cash receipts; inspect tenant-paid versus owner-paid utilities and the capital schedule. Compare suburban sold NOI with similar properties, preserving expense and reserve conventions.
Evidence: Marcus & Millichap — Baltimore Q2 report, pp. 1–2 · Maryland SDAT — property record definitions. Retrieved October 19, 2026. Interpretations and property decisions are RentalCalcs analysis.
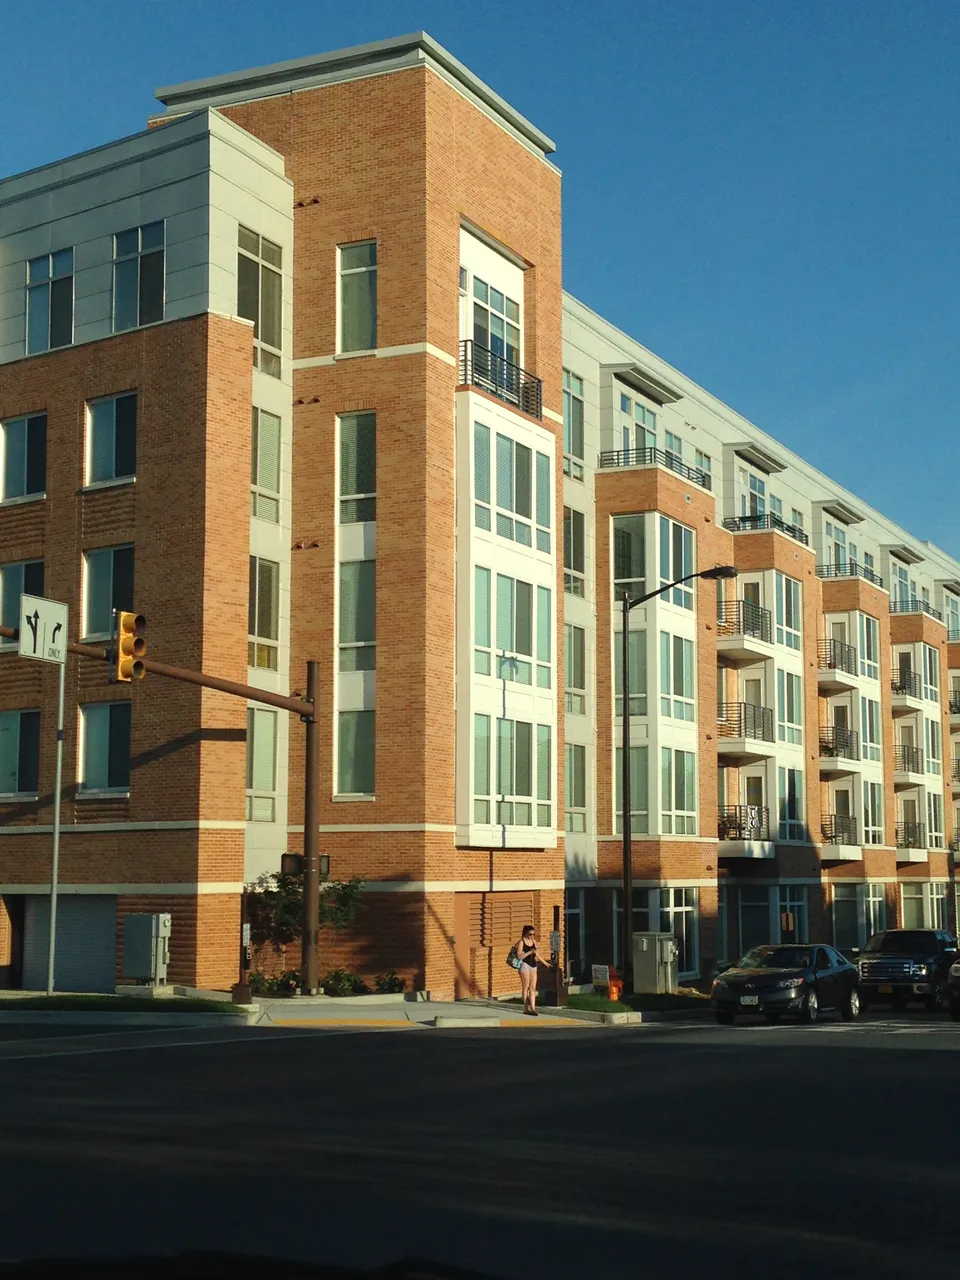

Recently delivered apartments: incentives can outlast the construction peak
Observed evidence and boundary. Harbor Stone’s August snapshot describes reduced construction and prevalent incentives among newer communities. It uses CoStar and its own research through Q3 to date rather than a completed-quarter census.
A smaller pipeline gives delivered properties more time to lease, but a tenant receiving a promotion today may face a materially different renewal decision next year. Existing communities compete on net lease cost as well as amenities. Build income from the signed leases, not an assumption that all discounts end immediately.
Direction. Editorial interpretation: the supply slowdown supports investigating stabilization while incentive exposure limits immediate compression. The report’s forecast of reduced future deliveries is not a guarantee of the subject’s occupancy.
What would change the view. Collections after free-rent periods and fewer renewed promotions would strengthen the case. Incentives spreading to older competitors would weaken it even as construction falls.
Before underwriting. Audit concessions by start and expiration date and compare total lease consideration. Stress a second promotion at renewal. Keep quarter-to-date evidence separate from March measures when explaining a trend.
Evidence: Harbor Stone — August Baltimore snapshot. Retrieved October 19, 2026. Interpretations and property decisions are RentalCalcs analysis.
Montgomery and Prince George’s: county lines and legal rent come first
Observed evidence and boundary. No matched current county cap series is assigned here. Montgomery County’s official exemption guidance identifies jurisdiction and property-specific boundaries for rent stabilization; a Washington metro average would not resolve them.
A property’s rent history, exemption status and municipal location can constrain the income available to a buyer. A physical renovation does not automatically establish a lawful reset to market rent. A regional demand assumption should therefore be separated from the legally collectible income schedule.
Direction. Editorial interpretation: capitalize the income the property can actually earn under its applicable rules. Any exemption, permitted increase or post-work income needs documentary support before it enters the base case.
What would change the view. Verified eligibility and a compliant lease history can reduce uncertainty. An unconfirmed exemption or a model using another municipality’s rules invalidates a projected-income cap.
Before underwriting. Confirm exact municipality, rental licensing and applicable current rules with the administering authority. Obtain the rent ledger, notices, exemption documentation and a qualified review of the subject. Do not extend Montgomery guidance across Prince George’s County.
Evidence: Montgomery County — rent stabilization exemptions. Retrieved October 19, 2026. Interpretations and property decisions are RentalCalcs analysis.
Frederick, the Eastern Shore and Western Maryland: separate the local exit
Observed evidence and boundary. This edition establishes no current matched cap cohort for these regions. SDAT provides parcel information, not investment cap-rate evidence.
A commuter-oriented rental, a seasonal lease and a small employer-dependent building can have different vacancy calendars and exit buyers. Identify the actual product and renter alternatives before choosing the sale comparables. A statewide label hides this more than it explains it.
Direction. Editorial interpretation: use a provisional exit and bottom-up bid until local transactions and debt quotes support a narrower assumption. Thin evidence is not a reason to import Baltimore’s cap.
What would change the view. Several verified local apartment sales with consistent income would improve confidence. A handful of asking listings or a residential price index would not resolve the missing NOI comparisons.
Before underwriting. Obtain parcel assessment, local comparable collections and financing terms for the subject’s size. Budget marketing carry and examine seasonal turnover where relevant.
Evidence: Maryland SDAT — property record definitions. Retrieved October 19, 2026. Interpretations and property decisions are RentalCalcs analysis.
Secondary markets and missing evidence
| Market | Coverage | Remaining gap |
|---|---|---|
| Baltimore city and selected suburbs | Dated average cap, March operating comparisons, August pipeline/incentive commentary | No representative neighborhood cap series; cohorts and periods cannot be blended. |
| Montgomery / Prince George’s | Jurisdiction-specific rental diligence; no quantitative cap assignment | County-only cap observations and subject-specific lawful rent require separate verification. |
| Frederick / Eastern Shore / Western Maryland | Coverage gap and local document checklist | Matched sale NOI, current local operations and realistic exit liquidity. |
No neighborhood cap is assigned without matching neighborhood evidence. Missing evidence is a reason to obtain more comparables, not to add an arbitrary geographic spread.
Three cap-rate paths, and the evidence each needs
Marcus & Millichap describes a class and geographic split in March operations alongside a Baltimore sale average. Harbor Stone’s later snapshot emphasizes declining construction but continued incentives. Those findings can coexist because they concern different cohorts and periods. Both draw on CoStar in part, so they are not independent confirmation of the same observation.
The broker forecasts favor gradual improvement, subject to labor and leasing conditions. Our base case is selective stabilization: separate a suburban collected-income acquisition from a downtown workout or a Washington-area regulated rent roll. Lower future deliveries cannot offset an unsupported legal rent or an omitted recurring expense.
Compression
Delivered stock leases without recurring promotions and ordinary comparable transactions show buyers accepting lower yields on verified income.
Watch: Post-incentive renewals, comparable sale mix, lender proceeds and collections by building class.
Invalidated or weakened by: Distress or portfolio allocations alone explain lower reported caps, or projected rent lacks legal support.
Underwriting consequence: Keep tighter exit pricing as upside; reconcile the subject’s lawful recurring NOI first.
Stabilization
Supply moderation helps occupancy while concessions, local costs and financing prevent broad multiple expansion.
Watch: Effective rents, ordinary financed transactions and buyer assessments.
Invalidated or weakened by: Persistent collection deterioration or a consistent repricing of matching stabilized properties.
Underwriting consequence: Use a flat exit, maintain reserves and independently price jurisdiction-specific costs.
Expansion
Lease-up incentives, employment exposure or unexpected work reduce net income while credit remains selective.
Watch: Renewal concessions, delinquency, restoration costs and debt sizing.
Invalidated or weakened by: Durable net receipts and competitive funded sales without aggressive rent adjustments.
Underwriting consequence: Lower leverage or price and stress a slower exit together with weaker NOI.
These are conditional RentalCalcs scenarios, not publisher probability forecasts or basis-point targets. Policy rates, Treasury yields, lender spreads and the borrowing constant are different inputs. No policy-rate cut is assumed to pass through automatically to property debt.
What a wider cap does to your property value
Value = annual NOI ÷ (cap rate ÷ 100). At constant income, a higher cap reduces value. A move from 5% to 6% is +100 bps and a 16.7% value decline, not a 1% decline.
From this market evidence to an offer
- Identify the actual jurisdictionRecord city/county, applicable rental rules and a documented lawful rent schedule.
- Reconcile the building’s incomeSeparate workout allocations, concessions and vacant work units from recurring collections.
- Match a fundable exitCompare similar sold NOI and buyer costs; keep missing county caps missing.
Hypothetical assumptions. NOI change is cumulative over your chosen holding period, not an annual growth rate. Results exclude debt, sale costs, taxes and interim cash flow.
Starting value $2,400,000
Exit value $2,080,000 (-13.3%)
$156,000 starting NOI at 6.5% → $156,000 exit NOI at 7.5%. NOI must change by 15.4% to preserve starting value at this exit cap rate.
Fixed reference matrix: your income has to offset the multiple
| Total NOI change | 6.00% exit | 6.50% exit | 7.00% exit | 7.50% exit |
|---|---|---|---|---|
| -10% total NOI | -2.5% | -10.0% | -16.4% | -22.0% |
| 0% total NOI | +8.3% | 0.0% | -7.1% | -13.3% |
| +10% total NOI | +19.2% | +10.0% | +2.1% | -4.7% |
| +20% total NOI | +30.0% | +20.0% | +11.4% | +4.0% |
This fixed matrix does not change when you edit the interactive tool. No selling costs, tax, debt payoff or interim cash flows are included. Total NOI growth is cumulative, not annual. Use a full cash-flow model for an investment return.
A buyer budget that reconciles before the debt
Hypothetical 20-unit acquisition at $2,400,000, with $1,500 scheduled monthly rent per unit. These assumptions illustrate a process; they are not market rents, quoted insurance or a forecast for any property.
Recompute legal rent, concessions and buyer costs before paying for a metropolitan cap. A downtown workout needs its own capital and carry plan.
| Budget line | Annual amount |
|---|---|
| Scheduled apartment rent | $360,000 |
| Other recurring income | $0 |
| Vacancy / concessions / collection loss | −$25,200 |
| Effective gross income | $334,800 |
| Buyer property taxes | −$38,000 |
| Insurance allowance | −$18,000 |
| Owner-paid utilities | −$22,000 |
| Recurring maintenance | −$68,000 |
| Management | −$22,000 |
| Administration / licenses / other recurring | −$10,800 |
| NOI before financing and reserves | $156,000 |
Going-in cap: 6.50%. Immediate work of $160,000 is capital spending outside NOI; recurring repairs are already included above. An annual $14,000 replacement reserve is deducted below NOI in this example.
| Measure | Result / assumption |
|---|---|
| Loan / interest / amortization | $1,320,000 / 6.75% assumed / 30 years; monthly amortizing payments, no interest-only period |
| Annual principal and interest | $102,738 |
| Replacement reserve outside NOI | $14,000 |
| Cash flow after debt and reserves | $39,262 |
| Down payment + closing + initial work | $1,080,000 + $72,000 + $160,000 = $1,312,000 |
| Cash-on-cash, before income tax | 2.99% = cash flow ÷ total invested cash |
| DSCR, before / after replacement reserve | 1.52× / 1.38× |
| Debt yield, before / after replacement reserve | 11.82% / 10.76% |
The interest assumption is not a current loan quote. DSCR = the stated NOI numerator ÷ annual debt service; debt yield = the stated numerator ÷ loan principal. Lenders may deduct reserves or make other adjustments. Closing and initial work are funded from cash; no extra initial reserve deposit is assumed. If a lender requires one, add it to invested cash. Yield on cost requires a separately defined stabilized NOI and total project basis; it is not the going-in cap.
How much room does this buyer actually have? The amortizing loan constant is 7.78%: annual debt service divided by loan principal. Compare that payment burden with the 6.50% going-in cap, rather than comparing the cap only with the interest coupon. In this example, adding leverage reduces current equity cash yield before tax.
With debt service and reserves fixed, an annual NOI reduction of $39,262 (25.2%) would consume the remaining cash flow. This is an NOI stress, not the same percentage decline in rent; rebuild income and expenses separately.
Use SDAT’s parcel record as the start of a buyer budget
Maryland’s property-data definitions distinguish value, assessment information and property use. Verify the actual parcel, reassessment timing and local adopted charges; the seller’s cash bill is not a universal buyer estimate. The example uses a hypothetical allowance, not a statewide tax rate or a claim to a homeowner benefit.
Evidence: Maryland SDAT — property record definitions. Retrieved October 19, 2026. Interpretations and property decisions are RentalCalcs analysis.
Keep rent-regulation diligence inside its jurisdiction
Montgomery County’s exemption page identifies municipal exclusions and property-specific tests. Determine the subject’s applicable current regime and documented status before modeling rent changes. Obtain local licensing, lead/condition and commercial insurance review; an exemption from one rule does not establish exemption from all housing duties.
Evidence: Montgomery County — rent stabilization exemptions. Retrieved October 19, 2026. Interpretations and property decisions are RentalCalcs analysis.


Free worksheet: turn unknowns into document requests
The printable worksheet gives you room to record the source, date and buyer adjustment for every income, expense, capital and exit assumption. It includes this edition’s local checks.
For a full property model, use the multifamily calculator. The single-family calculator supports a separate 1–4-unit workflow. These links do not transfer this page’s inputs; re-enter and verify your assumptions.
Compare local screening context: Baltimore County screening context · Montgomery County screening context. County rent-to-price screens are modeled indexes, not matched closed-sale NOI caps. Explore the Maryland market directory.
Questions before an offer
Does 6.5% apply to all Maryland apartments?
No. It is the Baltimore report’s average with stated sale-scope limits. It does not price another county or establish a neighborhood yield.
Are the 6.5% downtown vacancy and 6.5% cap the same measure?
No. One describes unoccupied apartments in a submarket; the other is a metro income-to-price measure. Identical numbers do not make them comparable.
Can I apply Montgomery’s exemptions to Prince George’s?
No. Establish the actual jurisdiction, property status and current administering guidance before projecting rent. The page deliberately assigns no county cap from those rules.
Source ledger, dates and refresh rules
Research retrieved October 19, 2026. Observations, publisher outlooks and our conditional interpretation are labeled separately. This ledger summarizes publicly available research; it does not redistribute proprietary report datasets. Brokers may be selling services or properties; appraisal commentary is not a guarantee of future pricing.
Marcus & Millichap — Baltimore Q2 report, pp. 1–2
Geography: Baltimore metro; named operating submarkets. Period: Operations March / sales through Q1 2026. Published: Q2 report; public file July 2026. Accessed: 2026-10-19.
Property scope: Multifamily / apartments. Class: Specified in the observation; otherwise undisclosed. Substantive review: 2026-10-19.
Provider: Marcus & Millichap; CoStar, RealPage, RCA; BLS for employment. Measure: 6.5% cap average; class/submarket vacancy. Statistic: Average sale cap and separate operating statistics.
NOI convention: Not disclosed; do not assume trailing or forward NOI unless explicitly stated beside the observation.. Sample: Not disclosed. Weighting: Not disclosed.
Limits: Generally $1m+ sales. Cap subset, weighting and NOI basis undisclosed. Forecast panels are not observations. Refresh: Next publisher edition, correction, changed listing or material rule change.
Harbor Stone — August Baltimore snapshot
Geography: Baltimore metro. Period: August / Q3 2026 to date. Published: 2026-08-31. Accessed: 2026-10-19.
Property scope: Multifamily / apartments. Class: Specified in the observation; otherwise undisclosed. Substantive review: 2026-10-19.
Provider: CoStar and Harbor Stone Advisors. Measure: Construction and incentives. Statistic: Operating commentary.
NOI convention: Not disclosed; do not assume trailing or forward NOI unless explicitly stated beside the observation.. Sample: Not disclosed. Weighting: Not disclosed.
Limits: Quarter-to-date, not completed-quarter data; shared CoStar lineage. Refresh: Next publisher edition, correction, changed listing or material rule change.
Maryland SDAT — property record definitions
Geography: Maryland parcels. Period: Guidance accessed October 19, 2026. Published: Not stated. Accessed: 2026-10-19.
Property scope: Property guidance; not cap evidence. Class: Not applicable. Substantive review: 2026-10-19.
Provider: Official administering authority. Measure: Assessment, property use and parcel data definitions. Statistic: Official guidance / diligence resource.
NOI convention: Not applicable: official property guidance, not cap evidence. Sample: Not applicable. Weighting: Not applicable.
Limits: Verify current address-specific application and adopted rules; not a property quote. Refresh: Next publisher edition, correction, changed listing or material rule change.
Montgomery County — rent stabilization exemptions
Geography: Montgomery County only; municipal boundaries explicit. Period: Guidance accessed October 19, 2026. Published: Not stated. Accessed: 2026-10-19.
Property scope: Property guidance; not cap evidence. Class: Not applicable. Substantive review: 2026-10-19.
Provider: Official administering authority. Measure: Property and jurisdiction exemption diligence. Statistic: Official guidance / diligence resource.
NOI convention: Not applicable: official property guidance, not cap evidence. Sample: Not applicable. Weighting: Not applicable.
Limits: Verify current address-specific application and adopted rules; not a property quote. Refresh: Next publisher edition, correction, changed listing or material rule change.
Refresh the affected figures and interpretation together when a new edition, correction or material operating rule appears. A retrieval or rebuild is not a new observation. Report a correction through RentalCalcs contact, including the source, edition, geography and affected claim.