

Which income and sale cohort does the cap describe?
Cap rate is annual net operating income divided by price, before financing. A lower quoted cap can describe stronger assets, depressed current earnings or a different calculation. Match the actual statistic before comparing yields.
On narrow screens, swipe tables sideways for all columns. Keyboard users can focus each table region and use the arrow keys.
Dated pricing references
In-place range
4.25–4.75% describes selected quality/value-add trades using current income.
Stabilized description
High-4% to low-5% describes a different, high-quality stabilized cohort.
Buyer target
Mid-5% is a commodity-product buyer objective, not a confirmed traded metro average.
| Reference | Published cap | Comparison and limits |
|---|---|---|
| Atlanta — selected quality / value-add Q2 2026 / first-half trades | 4.25–4.75% in-place range | Selected trade description, not a metro average or forward stabilized cap. Cap-reporting count and weighting undisclosed; asset selection matters. |
| Atlanta — high-quality stabilized Q2 2026 | High-4% to low-5% range | Separate stabilized cohort; no invented decimal endpoints. Not directly comparable with an acquisition using depressed in-place income. |
| Atlanta — commodity in high-supply pockets Q2 2026 | Mid-5% buyer target | Desired buyer yield; not a verified closing range. Difficult trading conditions; a buyer target does not prove executable seller pricing. |
| Market / period | Vacancy / rent | Annual change and boundary |
|---|---|---|
| Atlanta Q2 2026 | 5.8% $1,655 asking / month | +1.3% YoY. CoStar / Northmarq; source page-one quarter-label error is not treated as Q3 data. |
| North DeKalb / Midtown Q2 2026 | No local rate used here Asking-rent series | +3.7% / +3.6% YoY. Local rent growth is not evidence of neighborhood cap compression. |
Physical vacancy and asking rent do not establish collections. Cap sample counts, weighting and NOI conventions remain unknown where the source does not disclose them. Brokerage publishers have commercial interests; shared underlying data are not independent confirmation.
What changes this property’s income?
These local mechanisms identify evidence to obtain, not neighborhood yield adjustments.
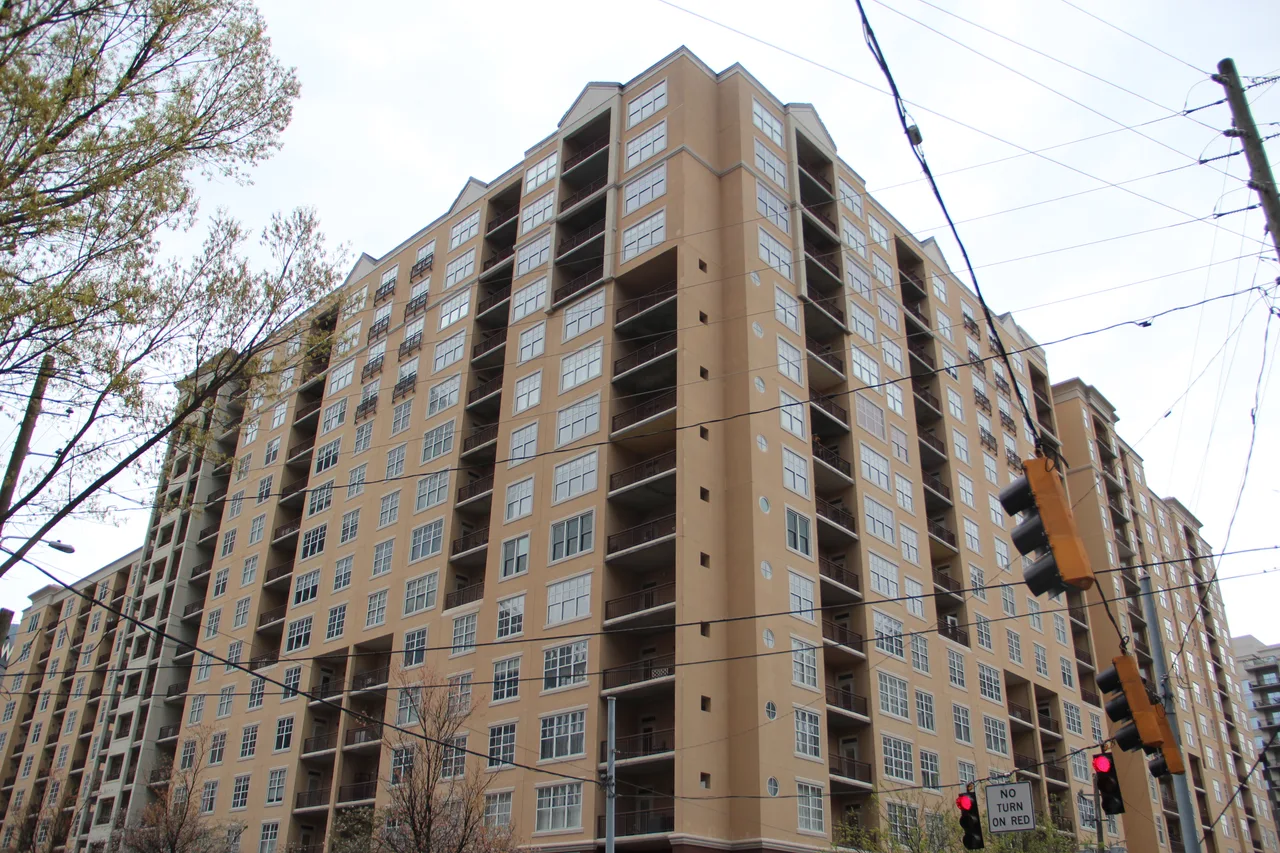
Midtown and Sandy Springs: price the income bridge, not the sale headline
Observed / attributed: Northmarq’s Q2 sales page says the second quarter included a larger share of mid- and high-rise sales in Midtown and Sandy Springs; its transaction table provides price and units without asset NOI.
A newer, larger sale can lift reported pricing while an older property’s value is unchanged. The low in-place yield on an incompletely leased or value-add asset may reflect expected income rather than cheap financing. Capital work, downtime and concessions are the cash cost of that expectation.
RentalCalcs interpretation: Use three income columns: trailing collections, buyer first-year NOI and stabilized NOI after funded work. Compare a reported in-place cap only with the first two on a matching convention. Applying the same low cap to the seller’s stabilized income would pay for the recovery twice.
Counterevidence and the property decision
Matched sales with normalized trailing earnings and funded capital plans could support stronger pricing. Unachieved renovation rents or concessions continuing after occupancy stabilizes would undermine the income bridge.
Obtain: Obtain the closing income basis, allocation of initial work, lease-expiration schedule and buyer expense adjustments. Identify which units are already renovated and collecting the assumed rent; do not call all occupied units stabilized.
Sources: Northmarq — Atlanta Q2 2026

Far North and Far East: leasing success can create competing exits
Observed / attributed: Northmarq identifies strong leasing in the Far North and Far East and prospective stabilized-property sale activity in Henry County and South Cobb/Douglasville.
As newer communities season their earnings, supply pressure can move from the leasing market into the sale market. An older garden seller may then compete with a newer, recently stabilized community seeking an exit. Fewer starts do not remove delivered vacant inventory or give every property the same buyer pool.
RentalCalcs interpretation: Keep the hold-period exit separate from today’s leasing recovery. Demonstrated occupancy gains can justify less carry, but they do not prove that a commodity building will sell at the yield quoted for institutional assets. A smaller property’s renovation program needs a realistic all-in rent comparison against the newer stock.
Counterevidence and the property decision
Rapid absorption with incentives withdrawn, fewer marketed assets and funded older-building closings would strengthen the case. Newer stabilized properties taking longer to sell would weaken exit-liquidity assumptions even if leasing improves.
Obtain: Track actual competing availability and marketed sale inventory within the subject’s tenant catchment. Request a loan quote on buyer first-year NOI and a sale-timing contingency; keep work, turnover and extended carry funded.
Sources: Northmarq — Atlanta Q2 2026

North DeKalb versus Midtown: asking growth must survive collection and buyer costs
Observed / attributed: Northmarq identifies North DeKalb and Midtown as rent-growth leaders in its Q2 asking series. MMG’s newer Q3 summary still shows a slight annual rent decline in its metro inventory.
The figures differ in geography, quarter and rent definition; a strong asking-rent pocket can coexist with a weaker metro effective-rent result. Substituting one for the other conceals incentives, unit mix and collection loss. Municipal boundaries also change the tax and operating diligence; a broker’s Atlanta label is not a parcel jurisdiction.
RentalCalcs interpretation: Credit rent upside only on units whose lease terms and actual collections support it. A documented renewal increase is more useful than applying Midtown’s asking trend across the roll. Reconcile county valuation and district millage before deciding how much of that increase reaches NOI.
Counterevidence and the property decision
Signed renewals with stable bad debt and buyer expenses would support more durable income. A broader asking-rent increase without improved receipts would not; a reassessment or insurance increase could consume the gain.
Obtain: Collect deposits, concessions, receivables, renewal dates, parcel tax districts and binding insurance. Distinguish occupied-unit increases from post-renovation vacant-unit rents and confirm notice and contractual conditions.
Sources: Northmarq — Atlanta Q2 2026 MMG — Atlanta Q3 2026 market report Georgia DOR — Property tax valuation
Where the evidence stops
| Area / product | Available | Still needed |
|---|---|---|
| Metro pricing segments | Selected in-place trade range, separate stabilized description and commodity buyer target. | Complete transaction NOI, cap-reporting sample and normalized neighborhood cohorts. |
| Midtown / Sandy Springs | Sale-mix and named-transaction context. | Asset-level income and like-for-like price trend; no implied sale cap from price per unit. |
| Far North / Far East / Henry / South Cobb-Douglasville | Leasing and prospective stabilization-driven sale mechanisms. | Current matched neighborhood cap series and actual marketed competitor inventory. |
| Small buildings, student and affordable housing | Buyer diligence framework. | Matching product-specific cap evidence; no automatic transfer of institutional pricing. |
Georgia cap-rate research supplies the broader state context.
Fulton County modeled screening tool retains a separate modeled screening purpose. It is not observed apartment sale evidence.
DeKalb County modeled screening tool retains a separate modeled screening purpose. It is not observed apartment sale evidence.
What would justify compression, stability or expansion?
Northmarq’s segmented first-half pricing and MMG’s newer operating improvement answer different questions. MMG reports 90.7% occupancy and a 0.4% annual rent decline in Q3; Northmarq’s earlier asking series was stronger. Those inventories cannot establish a sequential cross-publisher trend. RentalCalcs’ base case is selective income stabilization: leasing improves while bid yields remain sensitive to work, buyer expenses and the income convention. Two brokerage perspectives do not supply independent transaction confirmation when underlying lineage is unresolved.
Publisher forecast: Northmarq expects supply pressures to ease and vacancy to finish 2026 at 5.8%. MMG’s Q3 commentary expects a lighter delivery environment to support recovery. These are attributed publisher expectations, not measured year-end outcomes or a forecast of neighborhood cap compression.
Compression: the income bridge becomes documented cash
Renovated or newly stabilized assets season collections, remaining work is funded and lenders accept the demonstrated income.
Watch: Renewal receipts, falling incentives, matched trailing-NOI closings and executable loan terms.
Invalidation: Apparent occupancy recovery financed by incentives, lingering work or exit bids based on a still-unachieved pro forma.
Underwrite: Require evidence of completed execution before crediting tighter yields; keep a flat-cap reference.
Stabilization: better leasing, segmented bids
The supply wave recedes while newer and older properties compete for different buyers. Operating gains are partly absorbed by taxes, insurance and debt.
Watch: Stable collected NOI and matched bid yields despite changing aggregate sale mix.
Invalidation: A consistent direction in matched sale caps or a material sustained shift in effective receipts.
Underwrite: Underwrite buyer first-year income and actual work cash; do not use an institutional stabilized yield on a commodity pro forma.
Expansion: a delayed exit or income miss requires more yield
Additional stabilized assets seek exits, commodity liquidity stays thin or lenders size proceeds below the acquisition plan.
Watch: Withdrawn sales, longer marketing, renewal incentives and equity needed at refinance.
Invalidation: Improved collection quality plus funded comparable closings and adequate loan proceeds without speculative rent.
Underwrite: Run lower NOI and a wider exit together; budget extended carry and reduce the supported bid.
Conditional editorial cases, not measured probabilities or cap targets. Changes in policy rates do not establish the subject’s borrowing terms.
Test the income miss and wider exit together
The acquisition below produces $137,500 annual NOI at a 5.50% entry cap. Test twelve incremental free lease-months at $1,450 each while holding recurring expenses constant; this is a concession miss, not a reported Atlanta average.
From local risk to a supported bid
- Identify the income conventionMatch in-place, first-year and stabilized NOI before choosing a cap.
- Fund the transitionSchedule actual renovation downtime and additional lease incentives.
- Test the exit buyerCompare the lower collected NOI with a wider exit and financing on demonstrated earnings.
| Scenario | NOI | Exit cap | Gross value |
|---|---|---|---|
| Baseline income / entry cap | $137,500 | 5.50% | $2,500,000 |
| Income miss / same cap | $120,100 | 5.50% | $2,183,636 |
| Income miss / wider exit | $120,100 | 6.50% | $1,847,692 |
Hypothetical assumptions. NOI change is cumulative over your chosen holding period, not an annual growth rate. Results exclude debt, sale costs, taxes and interim cash flow.
Starting value $2,500,000
Exit value $2,115,385 (-15.4%)
$137,500 starting NOI at 5.5% → $137,500 exit NOI at 6.5%. NOI must change by 18.2% to preserve starting value at this exit cap rate.
| Total NOI change | 5.00% exit | 5.50% exit | 6.00% exit |
|---|---|---|---|
| -10% | -1.0% | -10.0% | -17.5% |
| 0% | 10.0% | 0.0% | -8.3% |
| 10% | 21.0% | 10.0% | 0.8% |
| 20% | 32.0% | 20.0% | 10.0% |
The fixed table does not change with the tool. Growth is cumulative, not annual. Value = annual NOI ÷ (cap percent ÷ 100). All scenario inputs are assumptions; a 5% to 6% cap move is +100 basis points, not a 1% fall in value.
Reconcile the buyer’s income, debt and cash
Illustrative 24-unit acquisition: $2,500,000 price and $1,450 monthly rent per unit. Every budget input is a hypothetical assumption, not a property quote or local average. Test twelve incremental free lease-months at $1,450 each while holding recurring expenses constant; this is a concession miss, not a reported Atlanta average.
| Income or expense | Amount | Treatment |
|---|---|---|
| Scheduled income | $417,600 | 24 × $1,450 × 12 |
| Vacancy / collection loss | -$41,760 | 10% combined allowance; avoid double-counting concessions |
| Effective income | $375,840 | Before recurring expenses |
| Buyer property taxes | $42,000 | Parcel fair market value, assessment and district millage |
| Commercial insurance | $21,000 | Binding quote; deductibles and lost-rent terms |
| Management | $22,550 | 6% of effective income |
| Recurring repairs | $25,000 | Initial renovations excluded |
| Owner utilities | $30,000 | Actual contracts, bills and recoveries |
| Payroll / contracts / administration | $97,790 | Itemized recurring obligations |
| Total recurring expenses | $238,340 | Sum of the recurring cost rows |
| Net operating income | $137,500 | Effective income minus recurring costs; before debt |
| Replacement reserve | $14,400 | Below NOI in this example |
| Annual debt service | $105,379 | $1,375,000 loan; assumed 6.6%; 30-year monthly amortization |
| Cash after debt and reserve | $17,721 | Before income tax and distributions |
Buyer cost checks: Georgia DOR generally assesses taxable property at 40% of fair market value, subject to statutory exceptions. The actual bill depends on county valuation and each applicable district’s millage. Verify the parcel and buyer-use treatment; owner-occupied homestead benefits cannot simply be retained in an investor apartment budget.
A renovation budget is separate from recurring repairs and turnover. Obtain a commercial coverage quote, payroll and utility contracts, and a unit-by-unit work calendar. Concessions already inside the baseline loss allowance must not be subtracted again; the stress below is an explicitly additional miss.
The 55.0% loan-to-price assumption is not a lender offer. Down payment $1,125,000 + closing costs $75,000 + initial work $180,000 = $1,380,000 invested cash.
| Metric | Result |
|---|---|
| Going-in cap | 5.50% |
| DSCR before / after reserves | 1.30× / 1.17× |
| Debt yield before reserves | 10.00% |
| Cash-on-cash after debt and reserves | 1.28% |
Initial capital work is separate from recurring repairs. NOI divided by price plus initial work gives 5.13% yield on cost, excluding closing costs. It is a different denominator from going-in cap.
Original collected-income stress: An incremental loss of $17,400 collected annual income reduces NOI to $120,100, cash after debt/reserves to $321, and gross value by $316,364 at the same 5.50% cap. This is the same income miss tested above, not an additional cumulative loss.
Including closing and initial work, total acquisition cost is $2,755,000. Unlevered NOI yield on that complete cost is 4.99%, distinct from going-in cap and the narrower work-only yield above. No initial reserve deposit is assumed; add any lender-required deposit to cash and cost. Negative cash means additional funding is needed.
Run the full property analysis
The research and core calculation are free. Assumptions do not transfer to the linked calculator; enter them there. A tool click is separate from a completed calculation or saved deal.
Bring the missing evidence to the property
Are 4.25–4.75% caps a stabilized Atlanta average?
No. They describe selected quality/value-add in-place transactions. Stabilized institutional pricing and commodity buyer targets are separately described and cannot be blended.
Why can the median sale price fall during a leasing recovery?
The sold property mix can change. Different vintages, garden versus high-rise assets, locations and capital burdens can move the median without establishing a matched property value decline.
Can a lower rate justify buying the seller’s stabilized NOI?
Only a real loan offer and documented income bridge establish that case. Policy-rate expectations do not fund the work, lease-up loss or buyer expense changes.
Record trailing collected NOI, buyer year-one NOI and stabilized NOI separately. Fund renovation downtime and incremental concession months, then reconcile the exit income convention with comparable sales and actual debt proceeds.
Open the free Atlanta worksheet
Print or save to PDF after entering notes. Entries stay in the open page and are not automatically saved; no account is required.
Sources, lineage and refresh
Sources accessed and substantively rechecked October 22, 2026. Observation periods, publication days and review dates are separate. Existing numerical observations remain bound to georgia-2026-10-18-v2; a new local narrative does not create a newer market observation.
- Northmarq — Atlanta Q2 2026
Period: Q2 operations / first-half sales; companion published October 9, 2026. Published: See period; exact publication day undisclosed. Provider: Northmarq; CoStar; development chart also cites RealPage.
Method and limitations: Actual pages 3–5 reviewed. Selected in-place cap range, stabilized descriptive range and buyer target remain separate. Cap count/weighting/complete NOI convention undisclosed. Page-one rent bullet mislabels the quarter; no Q3 observation inferred.
Refresh: Next quarterly edition or publisher correction.
- Georgia DOR — Property tax valuation
Period: Guidance accessed October 18, 2026; publication day unstated. Published: See period; exact publication day undisclosed. Provider: Georgia Department of Revenue.
Method and limitations: Assessment mechanics; no statewide investor tax rate or parcel quote.
Refresh: Assessor notice, local millage or statutory change.
- Georgia DOR — Homestead exemptions
Period: Guidance accessed October 18, 2026. Published: See period; exact publication day undisclosed. Provider: Georgia Department of Revenue.
Method and limitations: Owner-occupancy and eligibility guidance; not assumed for an investor apartment purchase.
Refresh: Change in ownership, use or exemptions.
- Georgia OCI — Business insurance resources
Period: Guidance accessed October 18, 2026. Published: See period; exact publication day undisclosed. Provider: Office of Commissioner of Insurance and Safety Fire.
Method and limitations: Coverage education, not a premium estimate or confirmation of subject coverage.
Refresh: Binding quote, policy wording or renewal change.
- MMG — Atlanta Q3 2026 market report
Period: Q3 2026; trailing-four-quarter flows labeled separately. Published: Exact publication day not displayed. Provider: MMG public summary; underlying operating provider not identified in the inspected HTML.
Method and limitations: 90.7% occupancy and −0.4% annual rent change are a separate inventory and later quarter from Northmarq. Complete sample, weighting and rent-normalization details unavailable in the public summary. No independent sale-cap corroboration claimed; brokerage commercial context.
Refresh: Next report, correction or full methodology clarification.
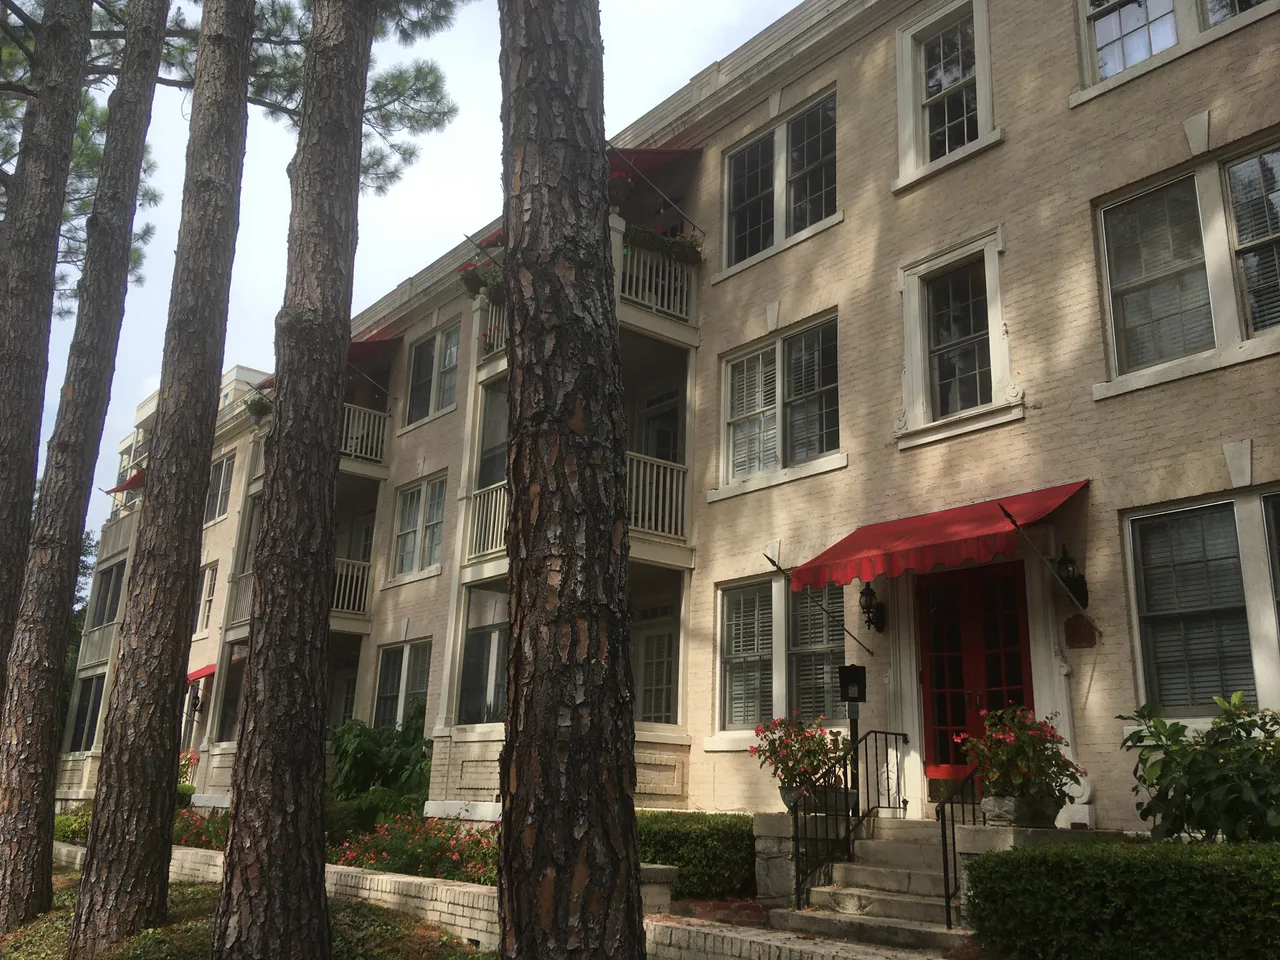
Three licensed documentary photos show the metro skyline, Midtown residential height and an established low-rise apartment form. They explain why different buildings require different income and capital budgets. Captured dates and derivative rights remain visible; pictured properties are not asserted as source transactions or evidence of current leasing conditions.
Only limited facts are summarized; proprietary graphics and reports are not redistributed. New evidence needs human review of narrative, assumptions, tools and worksheets before a new edition. Builds do not advance review dates. Send a correction with the affected claim and primary source.