

Which income and sale cohort does the cap describe?
Cap rate is annual net operating income divided by price, before financing. A lower quoted cap can describe stronger assets, depressed current earnings or a different calculation. Match the actual statistic before comparing yields.
On narrow screens, swipe tables sideways for all columns. Keyboard users can focus each table region and use the arrow keys.
Dated pricing references
Approximate sale average
Northmarq: approximately 5%, first half of 2026; changing vintage mix and undisclosed NOI normalization.
Publisher cap series
Matthews: 5.33%, Q2 2026; full transaction/model methodology undisclosed.
Comparison boundary
The 33-bps subtraction cannot establish market expansion. Match the income basis and buyer parcel costs first.
| Reference | Published cap | Comparison and limits |
|---|---|---|
| Charlotte publisher market — includes York County, SC First half 2026 | Approximately 5% average | Northmarq describes 4.7–5.25% since early 2025; not a neighborhood range. Cap count, weighting and NOI basis unstated; cross-state market and changing vintage mix. |
| Charlotte publisher cap series Q2 2026 | 5.33% publisher series | Different method and period from Northmarq’s approximate first-half sale average; their difference is not measured cap expansion. Cap sample, weighting, NOI convention and transaction/model definition undisclosed. |
| Market / period | Vacancy / rent | Annual change and boundary |
|---|---|---|
| Charlotte — cross-state publisher market Q2 2026 | 8.5% $1,568 asking / month | −1.4% YoY; +0.6% QoQ. Improving quarter but weaker annual rent; not effective collections. |
Physical vacancy and asking rent do not establish collections. Cap sample counts, weighting and NOI conventions remain unknown where the source does not disclose them. Brokerage publishers have commercial interests; shared underlying data are not independent confirmation.
What changes this property’s income?
These local mechanisms identify evidence to obtain, not neighborhood yield adjustments.
North Charlotte and University: fewer starts leave an existing leasing test
Observed / attributed: Northmarq identifies reduced construction activity in North Charlotte, Huntersville/Cornelius and University, while noting strong absorption and limited recent sales in North Charlotte.
A shrinking pipeline reduces future competition but does not erase delivered vacant units. A buyer can see strong leasing and still lack comparable closed sales. Newer low-rise and mid-rise assets may attract institutional bids while an older community competes through effective rent and a different capital budget.
RentalCalcs interpretation: Treat improved absorption as evidence to reduce an appropriately documented lease-up allowance, not as an automatic cap discount. Verify actual available units and incentives before assuming fewer starts will improve every renewal. Keep the exit comparable set open where recent sales are thin.
Counterevidence and the property decision
Competitors withdrawing promotions while preserving leasing pace and matched older-property closings would support more confidence. Repeated incentives or a larger marketed sale inventory would weaken the recovery-to-value bridge.
Obtain: Obtain competitor availability by unit type, actual delivered units still in lease-up, renewal receipts and two closings with an explicit NOI convention. Put the subject’s work and lease expirations on the same calendar.
Sources: Northmarq — Charlotte Q2 2026
Uptown–South End and Midtown: job access is a mechanism, not booked rent
Observed / attributed: Marcus & Millichap’s public Q2 abstract reports tightening close-in vacancy through March and describes the Pearl innovation district as a projected longer-term demand catalyst.
A projected employment buildout does not supply today’s renters, guarantee their household formation or establish their affordable housing budget. A building’s transit and commute options can connect it to a job node, but a broad South End label cannot establish tenant substitution or renovation rent.
RentalCalcs interpretation: For close-in apartments, test the practical job-access advantage against live alternatives before paying for a future employment premium. The strong location case is durable collected rent and lower turnover, not merely a large announced job number. New urban supply can capture part of the demand.
Counterevidence and the property decision
Confirmed occupancy and payroll, successful renewals without concessions and scarce matched alternatives would strengthen the case. Hiring delays, changed commute patterns or continuing incentive competition would weaken it.
Obtain: Verify current commute options and employer timing, then obtain unit-type effective rents and turnover costs. Treat employment projections as a scenario trigger; do not capitalize them as current property NOI.
Sources: Marcus & Millichap — Charlotte 2Q 2026 public abstract


Mecklenburg versus York: identical rent does not mean identical buyer NOI
Observed / attributed: Mecklenburg’s official September update describes revaluation to January 1, 2027 values, with notices scheduled for early 2027. York publishes separate transfer-related assessment and exemption guidance.
The state line changes the assessment process; a seller’s current tax bill is not a transferable buyer expense forecast. A revaluation changes the value base, while the final tax also depends on adopted rates and districts. A county’s preliminary median increase is not a parcel’s future bill.
RentalCalcs interpretation: Compare cross-state acquisitions on buyer-adjusted NOI and total cash, not a headline cap alone. Keep Mecklenburg’s pending value and rate changes as separate sensitivities. For a York purchase, resolve transfer treatment and application requirements before counting any relief.
Counterevidence and the property decision
Actual parcel notices, adopted rates and confirmed buyer eligibility can replace the uncertainty allowance. A seller assertion or a generic statewide percentage cannot. Lower rates after a revaluation could offset some value increase, so a tax increase cannot be inferred from value alone.
Obtain: Obtain parcel records, jurisdiction and districts, latest notices, adopted rates, transfer classification and written exemption decisions. Compare the resulting annual tax with the same acquisition’s debt, reserves and exit value.
Sources: Mecklenburg County — 2027 revaluation update York County — ATI exemption guidance for 6% real property
Where the evidence stops
| Area / product | Available | Still needed |
|---|---|---|
| Cross-state Charlotte publisher market | Approximate first-half sale cap bound to NC evidence; a separate Q2 publisher series. | Matched cap sample, normalized NOI and exact provider crosswalk. |
| North Charlotte / University / Huntersville-Cornelius | Construction, absorption and sale-liquidity mechanisms. | Current comparable neighborhood cap series and delivered vacant units by competitor. |
| Uptown–South End / Midtown | Public close-in operating perspective and attributed employment outlook. | Full gated research, actual employer payroll and matched subject rent evidence. |
| Mecklenburg NC / York SC | Official revaluation and transfer-process guidance. | Buyer parcel determinations and future adopted rates; no blanket cross-state tax assumption. |
North Carolina cap-rate research supplies the broader state context.
South Carolina cap-rate research supplies the broader state context.
Mecklenburg County modeled screening tool retains a separate modeled screening purpose. It is not observed apartment sale evidence.
What would justify compression, stability or expansion?
Northmarq’s approximate first-half cap average and Matthews’ Q2 series both place the discussion near 5%, but the 33-basis-point arithmetic gap is not a measured trend. Their methods and cohorts are unresolved. Northmarq sees less supply pressure; Matthews still describes excess pipeline and weaker effective rent; Marcus & Millichap emphasizes close-in job access. RentalCalcs’ base case is uneven stabilization with no assumed exit compression. Lower construction can improve leasing before the seller and buyer agree on a funded value.
Publisher forecast: Northmarq expects vacancy to hold roughly steady through year-end and sales to improve if absorption persists. Marcus & Millichap expects the recovery to favor close-in job nodes. These are publisher outlooks; they do not establish future cap rates, completed hiring or property-level collections.
Compression: income certainty improves in the actual catchment
Competitive units clear, incentives fade and confirmed buyer costs allow funded bids on durable NOI.
Watch: Effective renewals, collected income, matched closings and quoted debt proceeds.
Invalidation: Asking growth without collection gains, a buyer-tax miss or comparable sales still requiring speculative stabilization.
Underwrite: Credit a tighter exit only after matched income evidence; keep acquisition work and initial carry funded.
Stabilization: lower supply meets cautious capital
Slower starts help leasing, but existing vacancies and expense uncertainty limit pricing power. Aggregate sale composition remains influential.
Watch: Flat effective NOI and consistent funded comparable yields across like buildings.
Invalidation: Persistent matched-sale repricing or a substantial change in effective rent and buyer costs.
Underwrite: Use unchanged-cap income sensitivity as the reference and test taxes independently before combining risks.
Expansion: cross-state cost or leasing assumptions fail
Buyer assessment, coverage or concessions reduce NOI while a thinner buyer pool requires more yield.
Watch: Parcel notices, policy quotes, concessions on renewals, marketing time and refinance equity calls.
Invalidation: Resolved stable costs and sustained receipts accompanied by funded comparable trades at lower yields.
Underwrite: Capitalize lower NOI at a wider exit and fund the cash gap; reduce the bid rather than invent a neighborhood premium.
Conditional editorial cases, not measured probabilities or cap targets. Changes in policy rates do not establish the subject’s borrowing terms.
Test the income miss and wider exit together
The acquisition below produces $143,000 annual NOI at a 5.50% entry cap. Test an additional annual tax and coverage obligation against the acquisition’s collected income before assigning value to the metro recovery.
From local risk to a supported bid
- Identify the parcel jurisdictionSeparate Mecklenburg revaluation from York transfer treatment.
- Replace the seller’s annual costsUse the actual buyer assessment, district rates and coverage; preserve the collected-income basis.
- Reprice and fund the downsideApply the wider exit to the lower NOI and check cash after debt and reserves.
| Scenario | NOI | Exit cap | Gross value |
|---|---|---|---|
| Baseline income / entry cap | $143,000 | 5.50% | $2,600,000 |
| Income miss / same cap | $131,000 | 5.50% | $2,381,818 |
| Income miss / wider exit | $131,000 | 6.25% | $2,096,000 |
Hypothetical assumptions. NOI change is cumulative over your chosen holding period, not an annual growth rate. Results exclude debt, sale costs, taxes and interim cash flow.
Starting value $2,600,000
Exit value $2,288,000 (-12.0%)
$143,000 starting NOI at 5.5% → $143,000 exit NOI at 6.25%. NOI must change by 13.6% to preserve starting value at this exit cap rate.
| Total NOI change | 5.00% exit | 5.50% exit | 6.00% exit |
|---|---|---|---|
| -10% | -1.0% | -10.0% | -17.5% |
| 0% | 10.0% | 0.0% | -8.3% |
| 10% | 21.0% | 10.0% | 0.8% |
| 20% | 32.0% | 20.0% | 10.0% |
The fixed table does not change with the tool. Growth is cumulative, not annual. Value = annual NOI ÷ (cap percent ÷ 100). All scenario inputs are assumptions; a 5% to 6% cap move is +100 basis points, not a 1% fall in value.
Reconcile the buyer’s income, debt and cash
Illustrative 20-unit acquisition: $2,600,000 price and $1,550 monthly rent per unit. Every budget input is a hypothetical assumption, not a property quote or local average. Test an additional annual tax and coverage obligation against the acquisition’s collected income before assigning value to the metro recovery.
| Income or expense | Amount | Treatment |
|---|---|---|
| Scheduled income | $372,000 | 20 × $1,550 × 12 |
| Vacancy / collection loss | -$37,200 | 10% combined allowance; avoid double-counting concessions |
| Effective income | $334,800 | Before recurring expenses |
| Buyer property taxes | $30,000 | Parcel and jurisdiction; future value and adopted rates tested separately |
| Commercial insurance | $18,000 | Commercial quote and flood determination |
| Management | $20,088 | 6% of effective income |
| Recurring repairs | $22,000 | Acquisition replacements excluded |
| Owner utilities | $26,000 | Meter map and enforceable recoveries |
| Payroll / contracts / administration | $75,712 | Itemized recurring obligations |
| Total recurring expenses | $191,800 | Sum of the recurring cost rows |
| Net operating income | $143,000 | Effective income minus recurring costs; before debt |
| Replacement reserve | $12,000 | Below NOI in this example |
| Annual debt service | $109,594 | $1,430,000 loan; assumed 6.6%; 30-year monthly amortization |
| Cash after debt and reserve | $21,406 | Before income tax and distributions |
Buyer cost checks: The reference is a hypothetical Mecklenburg acquisition. The county’s 2027 revaluation schedule does not establish this parcel’s next assessment or final bill; obtain the notice and adopted district rates. A York County alternative requires its own transfer and exemption determination. Do not carry owner-occupied treatment into an investor budget.
Obtain a commercial coverage quote and flood determination, reserve inspection and owner-paid utility records. State consumer insurance guidance is not proof of apartment coverage. Keep initial replacements separate from recurring repairs and reserves; test additional lender reserve deposits in invested cash.
The 55.0% loan-to-price assumption is not a lender offer. Down payment $1,170,000 + closing costs $78,000 + initial work $130,000 = $1,378,000 invested cash.
| Metric | Result |
|---|---|
| Going-in cap | 5.50% |
| DSCR before / after reserves | 1.30× / 1.20× |
| Debt yield before reserves | 10.00% |
| Cash-on-cash after debt and reserves | 1.55% |
Initial capital work is separate from recurring repairs. NOI divided by price plus initial work gives 5.24% yield on cost, excluding closing costs. It is a different denominator from going-in cap.
Original buyer-cost stress: An additional $12,000 recurring annual cost reduces NOI to $131,000, cash after debt/reserves to $9,406, and gross value by $218,182 at the same 5.50% cap. Reclassifying recurring costs as capital work would conceal this loss.
Including closing and initial work, total acquisition cost is $2,808,000. Unlevered NOI yield on that complete cost is 5.09%, distinct from going-in cap and the narrower work-only yield above. No initial reserve deposit is assumed; add any lender-required deposit to cash and cost. Negative cash means additional funding is needed.
Run the full property analysis
The research and core calculation are free. Assumptions do not transfer to the linked calculator; enter them there. A tool click is separate from a completed calculation or saved deal.
Bring the missing evidence to the property
Does the Charlotte cap belong only to North Carolina?
No. Northmarq’s publisher market includes York County, South Carolina. This cross-state report has one canonical; it does not create two copies or a state average.
Can I call 5.00% to 5.33% a 33-basis-point increase?
The subtraction is 33 basis points, but the sources differ in period and method. It cannot establish market expansion or a sale discount.
Does a 2027 revaluation percentage equal the tax increase?
No. A parcel value and adopted taxing-district rates jointly determine the bill. Preliminary county-wide median changes cannot replace either input.
Record parcel state, municipality, tax districts, ownership-transfer treatment and revaluation dates. Reconcile effective renewals and buyer expenses, then test the same annual cost miss with a wider exit and a funded cash contingency.
Open the free Charlotte worksheet
Print or save to PDF after entering notes. Entries stay in the open page and are not automatically saved; no account is required.
Sources, lineage and refresh
Sources accessed and substantively rechecked October 22, 2026. Observation periods, publication days and review dates are separate. Existing numerical observations remain bound to north-carolina-2026-10-18-v1; a new local narrative does not create a newer market observation.
- Northmarq — Charlotte Q2 2026
Period: Q2 operations / first-half sales; companion July 29, 2026. Published: See period; exact publication day undisclosed. Provider: Northmarq / CoStar; employment BLS.
Method and limitations: Pages 3–5. Approximate cap average; cap count, weighting and NOI basis unstated. Publisher geography includes York County, SC. Operating and sales cohorts not identical.
Refresh: Next quarterly report or correction.
- NC DOI — Flood insurance
Period: Guidance accessed October 18, 2026. Published: See period; exact publication day undisclosed. Provider: North Carolina Department of Insurance.
Method and limitations: Consumer flood guidance; commercial apartment coverages and premiums require their own quote.
Refresh: Flood determination, policy terms and renewal.
- Matthews — Charlotte Q2 2026
Period: Q2 2026. Published: 2026-08-13. Provider: Public HTML does not disclose the underlying cap-series provider; independence from CoStar is unverified.
Method and limitations: Publisher cap series 5.33%; transaction versus model method, cap-reporting count, weighting and NOI convention undisclosed. Effective rent and inventory differ from Northmarq; no blended cap or cross-publisher vacancy change.
Refresh: Next quarterly edition or methodology clarification.
- Marcus & Millichap — Charlotte 2Q 2026 public abstract
Period: Q2 outlook; vacancy comparison through March 2026. Published: Exact day not displayed. Provider: Marcus & Millichap; underlying public-abstract dataset undisclosed.
Method and limitations: Close-in demand and Pearl employment outlook; full report gated and not accessed. Projected jobs are not present payroll or a cap forecast. Commercial brokerage context; no independent transaction confirmation.
Refresh: New public outlook, actual project hiring or competing deliveries.
- Mecklenburg County — 2027 revaluation update
Period: 2027 revaluation preparations; value date January 1, 2027. Published: 2026-09-02. Provider: Mecklenburg County Office of Tax Administration.
Method and limitations: Official process and schedule, not a parcel assessment or an adopted future tax bill. Preliminary county medians cannot be applied to a specific apartment; future district rates also matter.
Refresh: Parcel notice, adopted county/municipal rates or schedule change.
- York County — ATI exemption guidance for 6% real property
Period: Current official document; exact publication date unstated. Published: Undisclosed. Provider: York County assessor.
Method and limitations: Transfer-related eligibility and application guidance, not a quote or automatic exemption. Buyer must resolve parcel classification, transfer treatment and applicable taxing districts.
Refresh: Ownership transfer, assessor determination or changed rules.
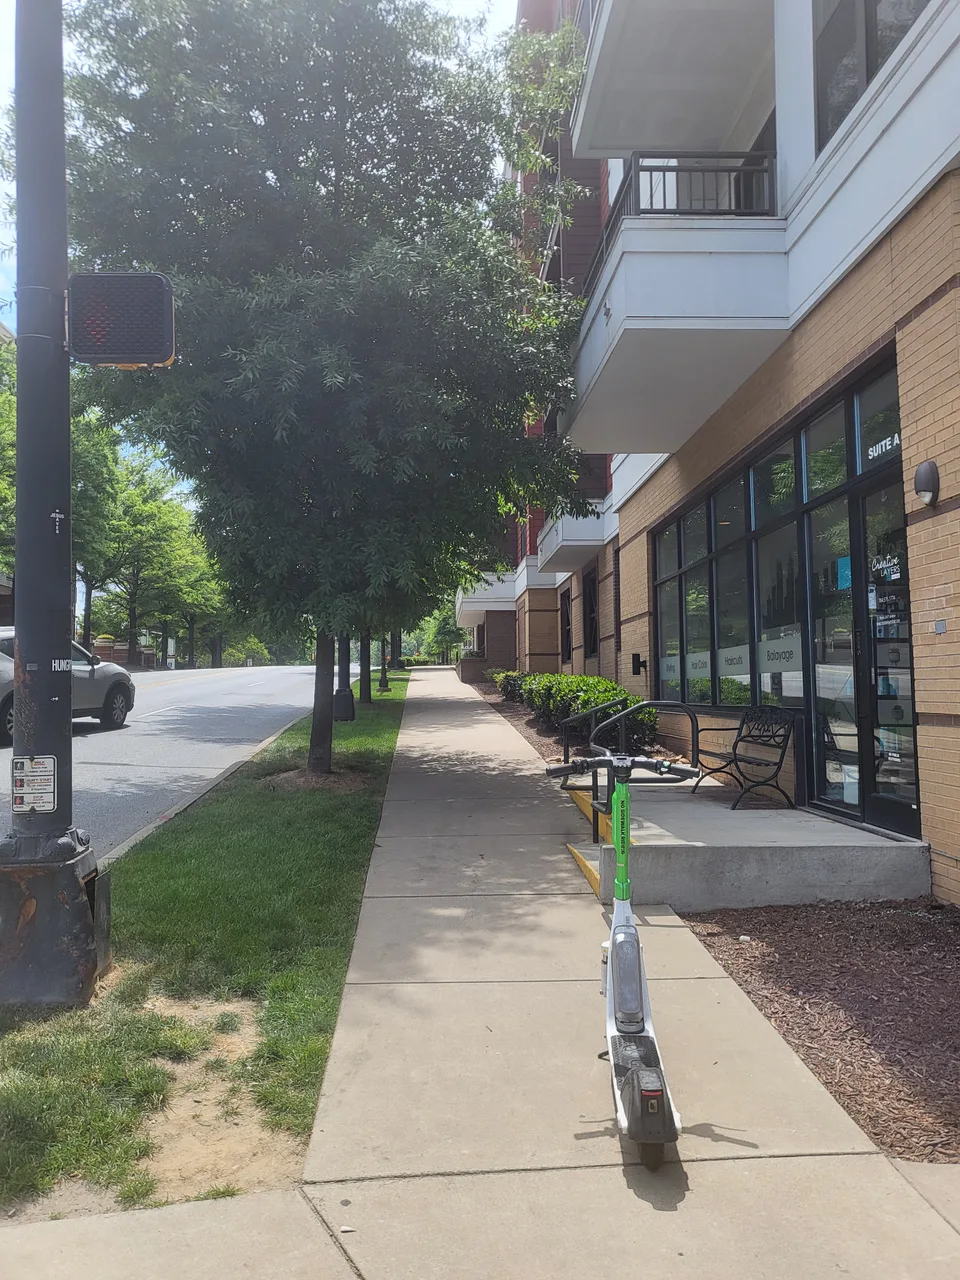
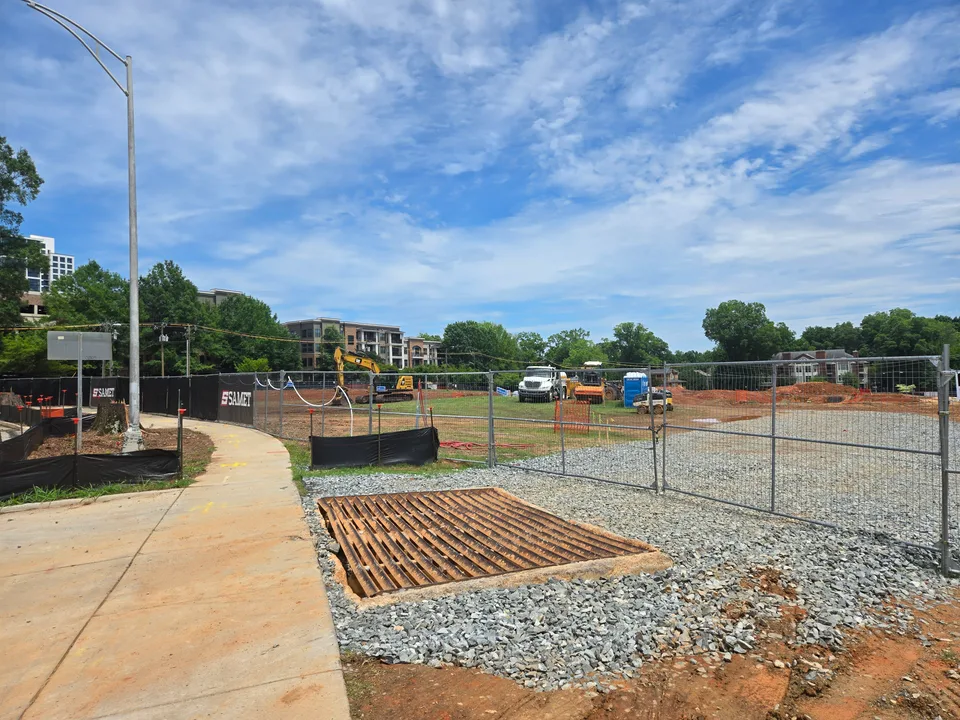
Three licensed documentary photographs establish the Charlotte skyline, a West Morehead apartment streetscape and a South Caldwell construction phase. Existing housing, site preparation and an operating market statistic are different forms of evidence. Photos retain their capture dates, rights and responsive local variants; neither photographed property is a claimed sale comparable, current rent quote or confirmation of present construction status.
Only limited facts are summarized; proprietary graphics and reports are not redistributed. New evidence needs human review of narrative, assumptions, tools and worksheets before a new edition. Builds do not advance review dates. Send a correction with the affected claim and primary source.