

Which income and sale cohort does the cap describe?
Cap rate is annual net operating income divided by price, before financing. A lower quoted cap can describe stronger assets, depressed current earnings or a different calculation. Match the actual statistic before comparing yields.
On narrow screens, swipe tables sideways for all columns. Keyboard users can focus each table region and use the arrow keys.
Dated pricing references
Northmarq transaction average
5.1% in Q2; the income convention and complete sample are not published.
Matthews separate series
5.44%; aggregation window and weighting remain unresolved.
No derived local cap
Rent, vacancy and pipeline observations do not establish neighborhood yields.
| Reference | Published cap | Comparison and limits |
|---|---|---|
| Nashville · Northmarq Q2 2026 | 5.1% | Published transaction average Down 20 bps year; cap count and NOI basis undisclosed. |
| Nashville · Matthews Q2 2026 page | 5.44% | Separate published cap series Aggregation window, cap sample and NOI convention not specified; do not blend with Northmarq. |
| Market / period | Vacancy / rent | Annual change and boundary |
|---|---|---|
| Nashville · Northmarq vacancy Q2 2026 | 7.8% Not supplied in this bound observation | −80 bps quarter. Publisher universe; not comparable to Matthews without a boundary crosswalk. |
| Nashville · Matthews vacancy / effective rent Q2 2026 | 5.40% $1,612 per month | Change not supplied in this bound observation. Separate universe; effective rent differs from Northmarq asking rent. |
Physical vacancy and asking rent do not establish collections. Cap sample counts, weighting and NOI conventions remain unknown where the source does not disclose them. Brokerage publishers have commercial interests; shared underlying data are not independent confirmation.
What changes this property’s income?
These local mechanisms identify evidence to obtain, not neighborhood yield adjustments.
Central and West Nashville: separate rent recovery from the sale mix
Observed / attributed: Northmarq reports West Nashville asking rents of $1,797, up 3.1% annually, while Downtown asking rents of $2,476 were down 1.7%. Matthews separately reports East Nashville annual rent growth of 1.6% and Central Nashville decline of 3.6%; its geography and rent series differ.
A tower can advertise a high rent while its effective receipts decline. An older West Nashville building can gain tenants without achieving tower pricing. Meanwhile Northmarq says Class B/C represented about three-quarters of first-half transactions; a changing sold cohort can lower the median even while the average cap tightens.
RentalCalcs interpretation: Match the subject’s vintage, floor plans, concessions and collections before choosing a sale cohort. The lower first-half median is not a repeat-sale depreciation index. Neither a downtown asking level nor a metro rent forecast establishes achievable renewal income in an older West Nashville acquisition.
Counterevidence and the property decision
Matched trailing-NOI closings and renewal receipts without incentives would strengthen the recovery case. Newer properties renewing tenants with concessions, or a cap change driven only by the class of buildings sold, would weaken it.
Obtain: Build a lease-by-lease effective-rent bridge. Identify concessions on occupied units, arrears and renovation downtime; obtain the actual sale NOI on comparable vintage and location. Keep publisher submarket labels on each observation.
Sources: Northmarq · Nashville Q2 2026, pp. 1–4 Matthews · Nashville Q2 2026

Franklin and the eastern corridor: fewer starts leave uneven competition
Observed / attributed: Matthews places construction at 12.5% of inventory in Franklin/Brentwood and 10.1% in Hermitage/Mount Juliet/Lebanon, versus 0.9% in Southeast and 1.1% in South Nashville. Northmarq separately reports Cool Springs/Franklin vacancy down 150 basis points annually, without an absolute submarket rate in that passage.
An improving vacancy trend can coexist with a concentrated future delivery calendar. The two publishers’ differently named corridors are not interchangeable. Northmarq’s discussion of fewer permits and possible 2028–2029 supply constraint does not remove projects competing during a buyer’s first renewal cycle.
RentalCalcs interpretation: Underwrite the floor plans and opening dates around the property rather than taking the metro construction slowdown as immediate pricing power. A longer lease-up and competing incentives consume cash before any later supply relief reaches NOI.
Counterevidence and the property decision
Delayed competing openings or sustained renewals with incentives withdrawn would reduce near-term risk. Several openings within one catchment would invalidate a quick normalization assumption even if metro vacancy improves.
Obtain: Map funded projects and actual opening dates, verify current availability by unit type and carry concessions through the overlap. Treat pipeline percentages as source-inventory exposure, not a forecast of vacancy or a neighborhood cap.
Sources: Northmarq · Nashville Q2 2026, pp. 1–4 Matthews · Nashville Q2 2026
Davidson, Williamson and Rutherford: price the parcel’s obligations
Observed / attributed: The Davidson Assessor distinguishes the revenue-neutral certified rate from the rate adopted by Metro and explains that the bill combines assessed value, property classification and the adopted rate. That is a local mechanism, not a tax quote for every Nashville-metro property.
A revenue-neutral reappraisal for a jurisdiction does not hold an individual building’s bill constant. General and Urban Services District boundaries, buyer use and property classification need parcel-level confirmation. Older electrical, water and building systems also turn nominal yield into a capital and insurance question.
RentalCalcs interpretation: Compare alternatives on buyer first-year NOI after actual recurring obligations, then deduct initial work separately from cash invested. A Williamson or Rutherford listing needs its own county and municipal bill; Davidson’s process cannot be exported across the metro.
Counterevidence and the property decision
A verified parcel bill, resolved classification and binding coverage can reduce uncertainty. A seller’s old assessment, unresolved appeal or unpriced repair condition cannot support a tighter bid.
Obtain: Obtain the current assessor record, tax district, adopted bill, assessment classification, open permits and inspection history. Have an insurer quote the actual property and review site-specific water exposure; no generic metro insurance allowance is evidence of coverage.
Sources: Davidson County Assessor — revenue-neutral reappraisal statement Tennessee Comptroller · assessment glossary Nashville Codes · services

Where the evidence stops
| Area / product | Available | Still needed |
|---|---|---|
| Nashville sale-cap series | Two labeled publisher series; Northmarq quarterly transaction average and Matthews separate investment series. | Complete cap count, matched sale NOI, weighting and a cross-publisher inventory crosswalk. |
| Central / East / West and Downtown | Named publisher rent observations on different definitions and boundaries. | Verified neighborhood cap rates, asset collections and a matched rent index across publishers. |
| Franklin / Brentwood and eastern corridor | Construction exposure and a separately defined Cool Springs/Franklin vacancy change. | Property-level competing opening dates and identical geographic coverage. |
| Small buildings, student and regulated apartments | Buyer diligence and funding framework. | Product-specific comparable cap samples; no transfer of institutional pricing. |
Tennessee cap-rate research supplies the broader state context.
Davidson County modeled screening tool retains a separate modeled screening purpose. It is not observed apartment sale evidence.
Rutherford County modeled screening tool retains a separate modeled screening purpose. It is not observed apartment sale evidence.
What would justify compression, stability or expansion?
Quarterly leasing improvement supports a recovery thesis, while the transaction mix limits claims about broad repricing. Northmarq’s 5.1% quarterly sale average and Matthews’ 5.44% series differ in method, not simply price. Asking and effective rents, and their inventories, must remain separate. RentalCalcs’ working case is improving income with corridor-specific carry risk; tighter exit yields require matched transactions and demonstrated collections. Two brokerage publications are not independent confirmation when underlying lineage is unresolved.
Publisher forecast: Northmarq projects year-end vacancy of 7.5% and sees reduced permitting constraining supply in 2028–2029. Matthews separately forecasts 5.0% vacancy and 2.2% rent growth by year-end in its own inventory. These are publisher forecasts, not measured outcomes or compatible bounds for one market estimate.
Compression: receipts and financing validate stronger bids
Remaining vacancy is absorbed without enduring incentives, work is funded and lenders recognize the collected income.
Watch: Signed renewals, net receipts, matched sale NOI and executable debt proceeds.
Invalidation: Occupancy gains funded by concessions or cap changes explained by a different sold-property mix.
Underwrite: Credit tighter yields only against matched evidence; retain a flat-cap bid reference.
Stabilization: improving income meets uneven corridor supply
Metro deliveries slow while concentrated openings compete through the first renewal cycle and buyer costs absorb some rent recovery.
Watch: Stable effective collections and matched bid yields alongside funded project openings.
Invalidation: Sustained income misses or consistently tighter comparable closings across the subject’s cohort.
Underwrite: Budget actual carry and buyer expenses; use demonstrated income rather than a metro forecast.
Expansion: concessions or buyer costs outrun recovery
Leasing takes longer, the tax or repair budget rises, or lenders size proceeds below the plan.
Watch: Renewal incentives, delayed closings, lower loan sizing and negative cash after reserves.
Invalidation: Durable collections plus adequate debt and funded comparable sales without speculative rents.
Underwrite: Stress lower NOI and a wider exit together; fund the cash deficit and lower the bid.
Conditional editorial cases, not measured probabilities or cap targets. Changes in policy rates do not establish the subject’s borrowing terms.
Test the income miss and wider exit together
The acquisition below produces $110,000 annual NOI at a 5.50% entry cap. Twelve additional free lease-months at $1,450 reduce collections by $17,400 with fixed recurring expenses. This hypothetical concession miss is incremental to baseline loss, not a reported Nashville average.
From local risk to a supported bid
- Match the sale cohortKeep quarterly averages and separate publisher series beside their income conventions.
- Locate remaining competitionMatch corridor openings to the subject’s first renewal cycle.
- Fund the income missTest incremental concessions, actual buyer expenses and a wider exit together.
| Scenario | NOI | Exit cap | Gross value |
|---|---|---|---|
| Baseline income / entry cap | $110,000 | 5.50% | $2,000,000 |
| Income miss / same cap | $92,600 | 5.50% | $1,683,636 |
| Income miss / wider exit | $92,600 | 6.50% | $1,424,615 |
Hypothetical assumptions. NOI change is cumulative over your chosen holding period, not an annual growth rate. Results exclude debt, sale costs, taxes and interim cash flow.
Starting value $2,000,000
Exit value $1,692,308 (-15.4%)
$110,000 starting NOI at 5.5% → $110,000 exit NOI at 6.5%. NOI must change by 18.2% to preserve starting value at this exit cap rate.
| Total NOI change | 5.00% exit | 5.50% exit | 6.00% exit |
|---|---|---|---|
| -10% | -1.0% | -10.0% | -17.5% |
| 0% | 10.0% | 0.0% | -8.3% |
| 10% | 21.0% | 10.0% | 0.8% |
| 20% | 32.0% | 20.0% | 10.0% |
The fixed table does not change with the tool. Growth is cumulative, not annual. Value = annual NOI ÷ (cap percent ÷ 100). All scenario inputs are assumptions; a 5% to 6% cap move is +100 basis points, not a 1% fall in value.
Reconcile the buyer’s income, debt and cash
Illustrative 18-unit acquisition: $2,000,000 price and $1,450 monthly rent per unit. Every budget input is a hypothetical assumption, not a property quote or local average. Twelve additional free lease-months at $1,450 reduce collections by $17,400 with fixed recurring expenses. This hypothetical concession miss is incremental to baseline loss, not a reported Nashville average.
| Income or expense | Amount | Treatment |
|---|---|---|
| Scheduled income | $313,200 | 18 × $1,450 × 12 |
| Vacancy / collection loss | -$31,320 | 10% combined allowance; avoid double-counting concessions |
| Effective income | $281,880 | Before recurring expenses |
| Buyer property taxes | $40,000 | Actual parcel, district and classification |
| Commercial insurance | $16,000 | Binding coverage and deductible quote |
| Management | $16,913 | 6% of effective income |
| Recurring repairs | $20,000 | Initial work excluded |
| Owner utilities | $20,000 | Bills, contracts and recoveries |
| Payroll / contracts / administration | $58,967 | Itemized recurring obligations |
| Total recurring expenses | $171,880 | Sum of the recurring cost rows |
| Net operating income | $110,000 | Effective income minus recurring costs; before debt |
| Replacement reserve | $10,800 | Below NOI in this example |
| Annual debt service | $84,303 | $1,100,000 loan; assumed 6.6%; 30-year monthly amortization |
| Cash after debt and reserve | $14,897 | Before income tax and distributions |
Buyer cost checks: Davidson’s revenue-neutral certification does not freeze a parcel bill or establish the adopted rate. Verify assessed value, classification, General or Urban Services District, municipal obligations and the current bill. Williamson and Rutherford require separate records. No future tax rate or appeal reduction is assumed.
Obtain the actual insurance terms and a building-systems inspection. Separate initial work and funded reserves from recurring repairs. The extra concession shock is additional to the baseline loss allowance; do not deduct a concession already included in collections twice.
The 55.0% loan-to-price assumption is not a lender offer. Down payment $900,000 + closing costs $60,000 + initial work $120,000 = $1,080,000 invested cash.
| Metric | Result |
|---|---|
| Going-in cap | 5.50% |
| DSCR before / after reserves | 1.30× / 1.18× |
| Debt yield before reserves | 10.00% |
| Cash-on-cash after debt and reserves | 1.38% |
Initial capital work is separate from recurring repairs. NOI divided by price plus initial work gives 5.19% yield on cost, excluding closing costs. It is a different denominator from going-in cap.
Original collected-income stress: An incremental loss of $17,400 collected annual income reduces NOI to $92,600, cash after debt/reserves to -$2,503, and gross value by $316,364 at the same 5.50% cap. This is the same income miss tested above, not an additional cumulative loss.
Including closing and initial work, total acquisition cost is $2,180,000. Unlevered NOI yield on that complete cost is 5.05%, distinct from going-in cap and the narrower work-only yield above. No initial reserve deposit is assumed; add any lender-required deposit to cash and cost. Negative cash means additional funding is needed.
Run the full property analysis
The research and core calculation are free. Assumptions do not transfer to the linked calculator; enter them there. A tool click is separate from a completed calculation or saved deal.
Bring the missing evidence to the property
Is 5.1% the right cap for every Nashville apartment?
No. It is Northmarq’s Q2 transaction average with undisclosed cap sample and NOI convention. Comparable property income and costs are still required.
Does 5.44% mean cap rates expanded 34 basis points?
No. Matthews publishes a different series. Its gap from Northmarq is not a measured time trend or a neighborhood premium.
Does falling permitting remove today’s leasing risk?
No. The possible 2028–2029 supply effect is later than current delivered vacancy and corridor projects. Match actual openings to the hold period.
Reconcile collected and asking rent, incremental concessions, corridor opening dates and the parcel’s actual tax district. Fund negative cash after reserves and test exit value with the same lower NOI.
Open the free Nashville worksheet
Print or save to PDF after entering notes. Entries stay in the open page and are not automatically saved; no account is required.
Sources, lineage and refresh
Sources accessed and substantively rechecked October 22, 2026. Observation periods, publication days and review dates are separate. Existing numerical observations remain bound to tennessee-2026-10-19-v1; a new local narrative does not create a newer market observation.
- Northmarq · Nashville Q2 2026, pp. 1–4
Period: Q2 / H1 2026. Published: 2026-09-11. Provider: Northmarq; vacancy CoStar; rents Yardi; sales CoStar.
Method and limitations: Cap sample weighting and NOI undisclosed; H1 median-price mix is not the quarterly cap sample.
Refresh: Next quarterly edition, source correction or material rule change
- Matthews · Nashville Q2 2026
Period: Q2 2026. Published: 2026-08-17. Provider: Matthews; provider not identified on public page.
Method and limitations: Unreconciled universe and cap window; do not blend with Northmarq.
Refresh: Next quarterly edition, source correction or material rule change
- Tennessee Comptroller · assessment glossary
Period: Current guidance. Published: Not stated. Provider: Tennessee Comptroller.
Method and limitations: Local appraisal, levy and parcel agreements required.
Refresh: Material rule change, revised guidance or parcel-specific confirmation
- Nashville Codes · services
Period: Current directory. Published: Not stated. Provider: Nashville / Davidson County government.
Method and limitations: Does not certify compliance or other city rules.
Refresh: Material rule change, revised guidance or parcel-specific confirmation
- Davidson County Assessor — revenue-neutral reappraisal statement
Period: 2025 reappraisal and 2026 appeal context. Published: Exact publication day not displayed. Provider: Davidson County Assessor.
Method and limitations: Official explanation of valuation, classification and adopted versus certified rates. Not a current parcel assessment, rate quote or guaranteed appeal outcome.
Refresh: Check current parcel value, classification, district and adopted tax bill before acquisition.
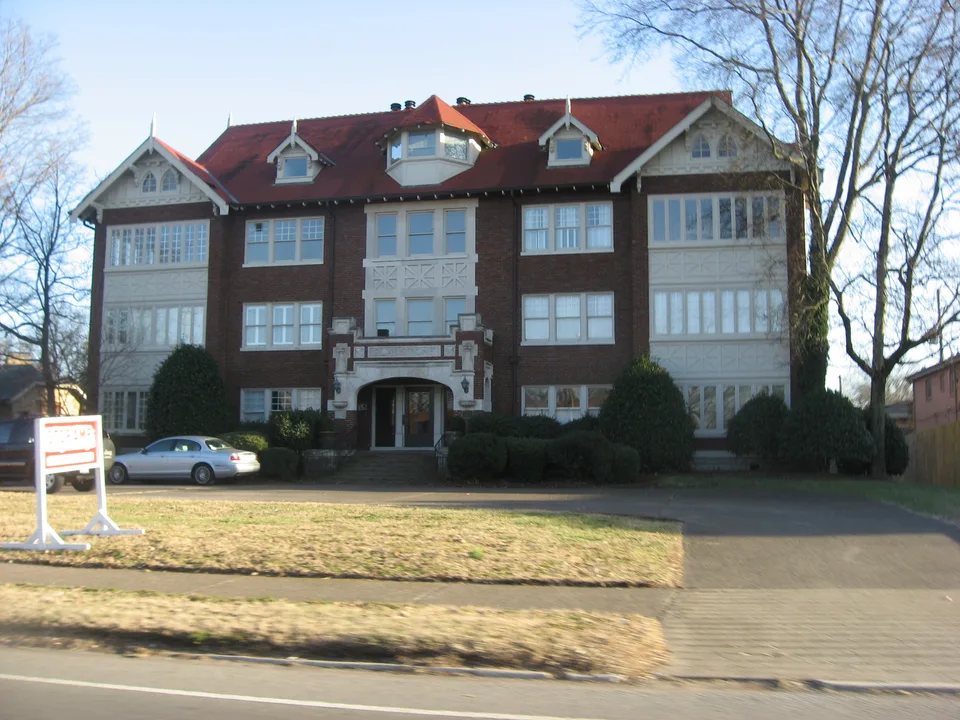
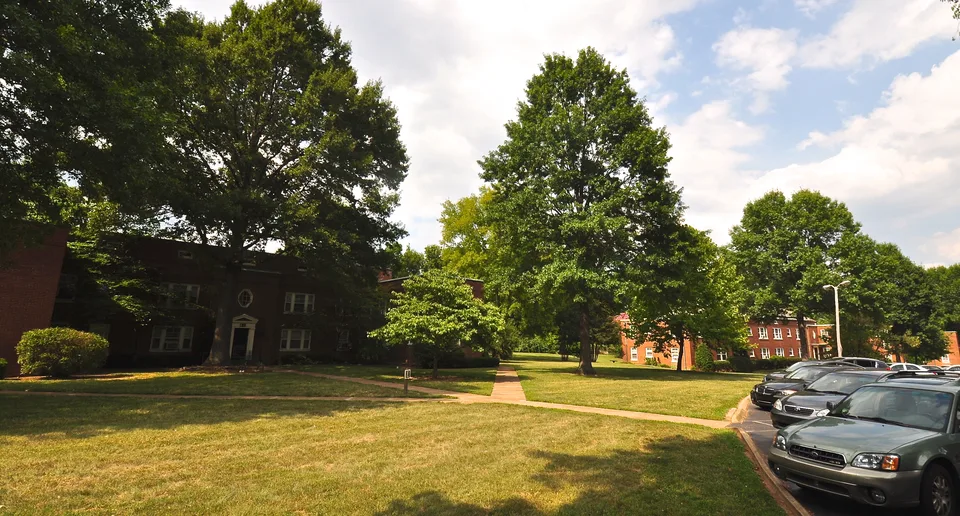
Three licensed documentary photos show metro context and two established apartment forms. Archival capture dates are visible. They illustrate building and repair differences, not current condition, sale comparables, corridor construction counts or achievable rents.
Only limited facts are summarized; proprietary graphics and reports are not redistributed. New evidence needs human review of narrative, assumptions, tools and worksheets before a new edition. Builds do not advance review dates. Send a correction with the affected claim and primary source.