Little Rock rent & investment research · AR
Little Rock metro rent report
Buy Little Rock’s verified collections; zero new apartment deliveries has not cured weak occupancy.
Zillow all-home metro asking-rent index · All bedroom counts · Seasonally adjusted
By RentalCalcs editorial · Reviewed
Live refresh status unavailable; showing the dated source snapshot shipped with this edition.

The investment view
Favor an occupied rental with a priced repair plan over a vacant building sold on an imminent rent recovery. The Q2 apartment reading was 89.3% occupied despite no completions over the preceding year. That is evidence to investigate tenant retention and collections, not pay a scarcity premium. Medical access can support a property’s leasing case, but the relevant worksite and lease history must support it.
Little Rock’s asking-rent trend does not settle a buyer’s collection risk
The provider-metro index is $1,234 per month, +2.4% from a year earlier and +9.3% over three years. It covers rental homes across the Little Rock provider market, including different property types and bedroom counts. It is the regional starting point; the seller’s rent roll must earn its own credibility.
Monthly rent data
| Month | Typical rent |
|---|---|
| September 2021 | $1,027 |
| October 2021 | $1,036 |
| November 2021 | $1,041 |
| December 2021 | $1,047 |
| January 2022 | $1,057 |
| February 2022 | $1,064 |
| March 2022 | $1,066 |
| April 2022 | $1,067 |
| May 2022 | $1,073 |
| June 2022 | $1,079 |
| July 2022 | $1,088 |
| August 2022 | $1,089 |
| September 2022 | $1,092 |
| October 2022 | $1,091 |
| November 2022 | $1,097 |
| December 2022 | $1,097 |
| January 2023 | $1,098 |
| February 2023 | $1,101 |
| March 2023 | $1,107 |
| April 2023 | $1,114 |
| May 2023 | $1,119 |
| June 2023 | $1,123 |
| July 2023 | $1,124 |
| August 2023 | $1,125 |
| September 2023 | $1,129 |
| October 2023 | $1,134 |
| November 2023 | $1,142 |
| December 2023 | $1,148 |
| January 2024 | $1,154 |
| February 2024 | $1,157 |
| March 2024 | $1,160 |
| April 2024 | $1,161 |
| May 2024 | $1,166 |
| June 2024 | $1,172 |
| July 2024 | $1,174 |
| August 2024 | $1,180 |
| September 2024 | $1,180 |
| October 2024 | $1,183 |
| November 2024 | $1,182 |
| December 2024 | $1,184 |
| January 2025 | $1,185 |
| February 2025 | $1,189 |
| March 2025 | $1,192 |
| April 2025 | $1,198 |
| May 2025 | $1,199 |
| June 2025 | $1,198 |
| July 2025 | $1,197 |
| August 2025 | $1,202 |
| September 2025 | $1,205 |
| October 2025 | $1,208 |
| November 2025 | $1,211 |
| December 2025 | $1,213 |
| January 2026 | $1,216 |
| February 2026 | $1,218 |
| March 2026 | $1,219 |
| April 2026 | $1,219 |
| May 2026 | $1,222 |
| June 2026 | $1,225 |
| July 2026 | $1,231 |
| August 2026 | $1,231 |
| September 2026 | $1,234 |
MMG’s earlier Q2 2026 apartment snapshot reported $1,028 average rent and 1.0% annual growth. Its 89.3% occupancy reading was 115 basis points below a year earlier, with 269 units of trailing-year net absorption and no completions. The positive absorption and weaker occupancy can coexist when survey composition or inventory changes; the public summary does not provide a matched-property reconciliation. We would not infer a precise empty-unit count from those figures.
For an acquisition, request twelve months of receipts, concessions, delinquency and move-outs by unit. Reconcile deposits to the ledger, separating security deposits from rent. A property that collected reliably through this environment supports a stronger business plan than a vacancy being explained away by the absence of construction.
A 1% rent increase can disappear when occupancy slips 1.15 percentage points
Illustration per available unit · before expenses
The underwriting implication is to protect an occupied lease before paying to chase a modest advertised increase. At an individual four-unit, one vacancy is a much larger discontinuity than a metro percentage suggests. Model that actual unit and its likely downtime; a smoothly averaged loss allowance can hide a near-term cash shortage.
The contrary case deserves weight: a construction pause gives existing apartments time to lease, and 269 absorbed units indicate some demand. But a buyer paying today for higher future occupancy needs evidence of that improvement. Require a current vacancy schedule and signed leases, rather than treating zero deliveries as a guarantee of pricing power.
A Bryant hospital transition is not a new tenant pool at Little Rock’s main campus
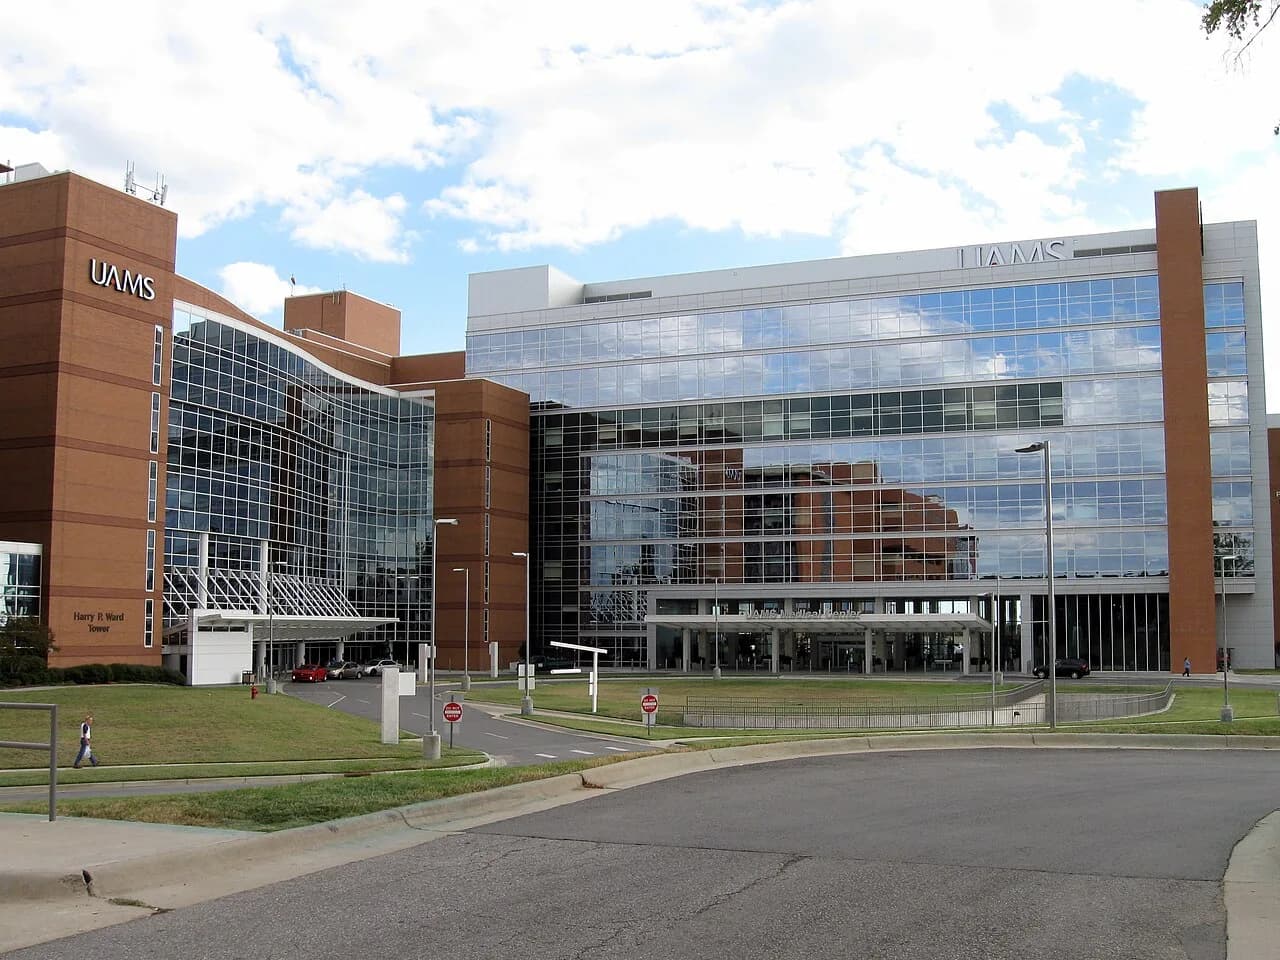

UAMS announced plans to take over operations at the existing 53-bed Encore Medical Center in Bryant, with an October 1, 2026 transition. The facility opened in 2021. The announcement supports the importance of a Saline County medical worksite; it does not establish 53 newly built beds, a net hiring count or a corresponding number of new renters near UAMS in Little Rock.
For a Midtown or Hillcrest acquisition pitched to medical workers, compare the property with alternatives serving the main campus, using the actual shift commute, parking and lease terms. For Bryant, build a separate set of Saline County house or apartment comparisons. Verify the tenant’s likely worksite without assuming every employee of one health system has the same daily trip.
Do not pay for furnished or short-stay income merely because a hospital is nearby. That strategy adds turnover, utilities, furnishing replacement and potentially different operating requirements. A standard annual lease supported by existing demand is the base case; a higher-service model needs a separate operating history and budget.
Use the Little Rock ZIP rent reference, Pulaski County research and Saline County research to screen geography before assembling property comparisons. Conway and North Little Rock also require their own competing-property set; inclusion in the metro index does not make them interchangeable.
A cheap South Main house can become an expensive rental after the exterior is priced
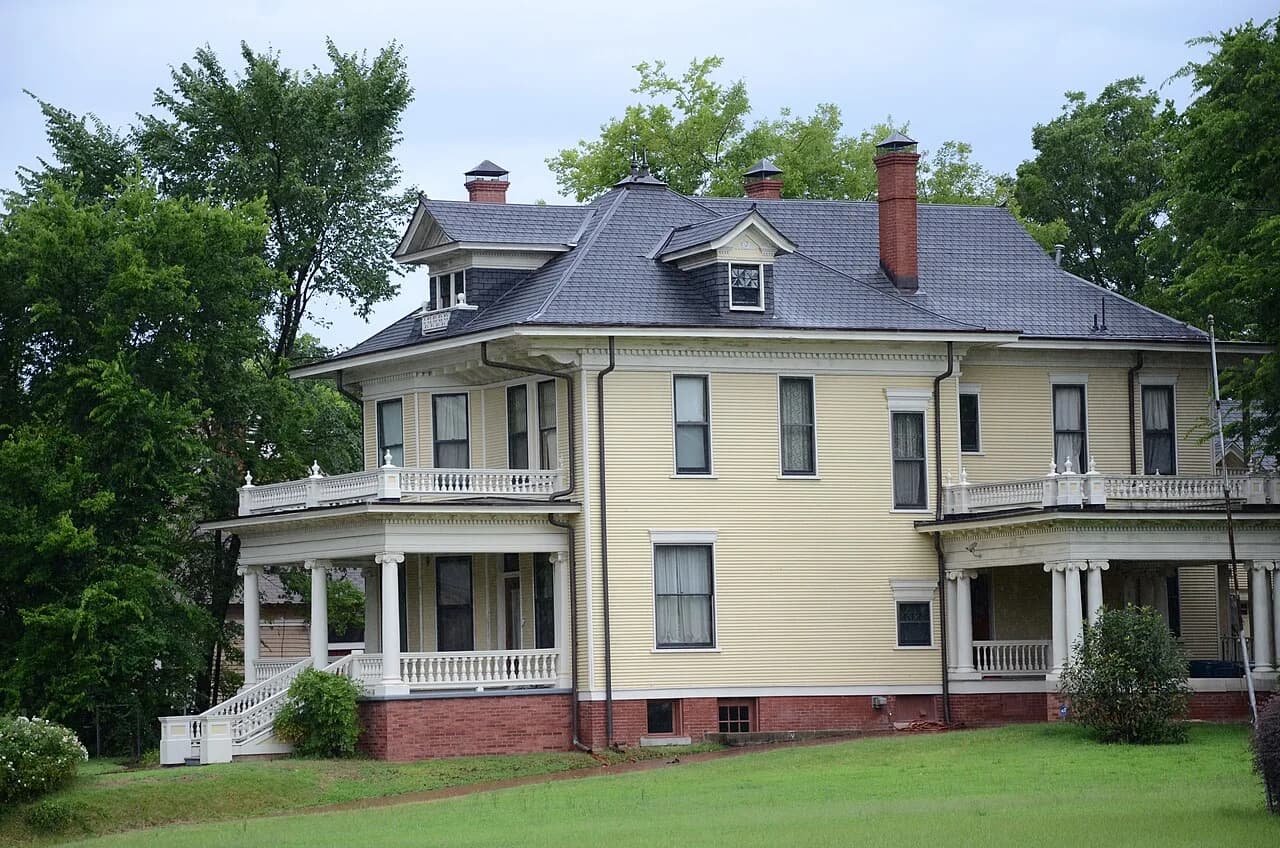
The lead photograph illustrates why an older house deserves a building budget before a rent premium. Large roofs, porches and exterior surfaces create costs that do not scale neatly with bedroom rent. Confirm permitted units, separate utility responsibilities and inspect drainage, foundation, mechanical systems and life-safety work. We have not inspected the pictured property and make no claim about its current use or condition.
Little Rock’s code-enforcement division investigates minimum housing violations and unsafe structures. Before buying a distressed asset, review its own open cases and required work with the city, then obtain written scopes and contractor pricing. A low purchase price is not a completed rehabilitation budget. Required repairs come before discretionary finishes.
For an occupied property, schedule work around actual leases and fund disruption separately. Replacing a failing system may preserve existing income without creating a higher rent. Treat that as necessary capital spending; do not manufacture a renovation return by assuming every repair produces a premium.
At $300,000, this Little Rock four-unit still needs a separate repair and vacancy reserve
The following occupied four-unit is hypothetical: $1,150 monthly per unit, 10% combined vacancy/collection loss, $22,000 annual operating expenses and $4,000 annual replacement reserves. The expense assumption must cover taxes, insurance, management, maintenance and owner-paid utilities. A $30,000 initial repair budget sits outside NOI. The model charges 3% acquisition closing costs and uses 65% purchase-price debt at an assumed 7% over 30 years.
Acquisition lab · assumed Little Rock property
Editable assumptions, not an available listing or financing quote. Closing costs are fixed at 3% of purchase price; repairs are paid upfront. No appreciation, tax benefits, refinancing proceeds or rent growth are needed to generate the results.
Edit property assumptions
| Measure | Base | Downside |
|---|---|---|
| Scheduled rent | $55,200 | $52,440 |
| After vacancy / collection loss | $49,680 | $45,623 |
| Net operating income (NOI) | $27,680 | $21,423 |
| Annual loan payments | $15,568 | $15,568 |
| Cash after debt + capital reserve | $8,112 | $1,855 |
| Debt coverage (NOI ÷ payments) | 1.78× | 1.38× |
NOI excludes financing and capital reserves. Operating expenses must include taxes, insurance, management, routine maintenance and owner-paid utilities. A reserve reduces spendable cash; it does not make a known roof or sewer replacement disappear. Results describe a stabilized year after initial repairs. Fund renovation downtime and carrying costs separately; they are not estimated here.
| Required yield | Base NOI | Downside NOI |
|---|---|---|
| 6.5% | $384,317 | $290,856 |
| 7.5% | $329,191 | $248,192 |
| 8.5% | $287,036 | $215,566 |
A price below a yield ceiling can still fail debt coverage or require more cash than you have. Check the loan terms, unit-level leases and a contractor’s scope before treating a modeled ceiling as an offer.
Base NOI is $27,680 on a $339,000 total basis, an 8.2% unlevered yield before reserves. The combined downside reduces rent 5%, raises loss to 13% and increases expenses 10%; NOI falls to about $21,423. Those are assumed returns, not surveyed Little Rock cap rates. Cash after debt and reserves is the constraint for a leveraged buyer.
The initial repair amount is not money available to fund a tenant’s missed payment. Set aside liquidity for an actual empty unit, insurance deductible and construction carrying costs beyond this stabilized-year calculation. If the asking price works only after loss falls sharply, negotiate the price using demonstrated collections or pass.
Buy demonstrated retention; renovate required systems before buying cosmetic upside
Acquire an occupied property with reconciled income
Favor a building whose tenants renew and pay, whose utility allocation is clear and whose capital scope is priced. An above-average collection record is useful evidence of a property’s resilience; it is not a reason to ignore imminent roof or mechanical work.
Hold a functioning rental through the recovery
When a resident pays reliably, compare a renewal with the full vacant-turn cost before insisting on the highest nearby asking rent. Small rent differences matter less than a vacancy, make-ready and replacement leasing fee together. Use the property’s actual renewal history to set that comparison.
Pass on a vacant acquisition with unfunded stabilization
A seller’s proposed medical-worker rent or metro recovery narrative does not service the loan. Require a funded leasing schedule, legal occupancy and a cash plan through slower absorption. Use the single-family calculator or multifamily analysis to extend the property budget after replacing these assumptions.
For renters, compare the condition, utilities and full lease cost with the advertised amount. A regional asking-rent increase does not establish the value of a poorly maintained unit.
Pay more only when newer occupancy and property collections improve together
| Signal | Investment response |
|---|---|
| A comparable newer survey improves occupancy while leases retain their effective rent | Revisit recovery-priced assets, using actual occupied income rather than a metro percentage target. |
| No completions, but the subject still loses tenants or grants incentives | Increase loss and leasing liquidity; lower supported purchase basis. |
| Documented hiring or relocation at the specific worksite produces signed local leases | Update that property’s demand case; do not capitalize the entire health system’s headcount. |
Sources and methodology
Evidence behind this report
- MMG Little Rock Q2 2026 public apartment snapshot: $1,028 average rent, 1.0% annual growth, 89.3% occupancy, -115bp annual occupancy change, 269 trailing-four-quarter net absorption and zero completions. Public page does not fully identify survey eligibility, geography or underlying vendor; do not treat it as an all-home vacancy census.
- UAMS June 24, 2026: plan to lease and operate the existing 53-bed Encore hospital in Bryant, opened 2021; planned operational transition October 1. Describes a transition, not 53 newly constructed beds or a quantified new workforce.
- UAMS September 8, 2026: surgeons joining October 1 at the Bryant hospital; employer/worksite distinction
- City of Little Rock code enforcement: minimum housing enforcement and unsafe structures; property-specific diligence, not evidence of any pictured building’s status
- Zillow all-home, all-bedroom, smoothed, seasonally adjusted metro ZORI CSV; observation 2026-09-30; retrieved 2026-10-21T03:09:00.655Z UTC
- Zillow repeat-rent methodology
- Census July 2023 metro delineations
- Zillow county-to-metro crosswalk, retrieved 2026-10-19
Geography and comparable populations
Official July 2023 county membership matches the counties in Zillow’s undated provider crosswalk. Provider RegionID and CBSA are distinct identifiers. Official CBSA: 30780; separate Zillow RegionID: 394798. County and city figures are useful local checks but cannot reproduce this metro index.
| County | State | Zillow crosswalk |
|---|---|---|
| Faulkner County | AR | Included |
| Grant County | AR | Included |
| Lonoke County | AR | Included |
| Perry County | AR | Included |
| Pulaski County | AR | Included |
| Saline County | AR | Included |
What the rent index measures
ZORI follows repeat asking-rent changes, weights toward the rental stock and smooths observations. It does not measure every signed lease, concessions, a two-bedroom quote, property income or a voucher payment standard. Broker apartment surveys have their own boundaries and property populations. Their vacancy and effective-rent readings are labeled by period and are never averaged into ZORI.
The headline and historical chart use one validated version. The file contains 740 metro rows; 740 have a latest-month observation. These are market counts, not rental-unit sample sizes; Zillow does not supply underlying unit sample counts here. Missing observations remain missing and prior months may be revised.
Refresh and editorial review
Provider Last-Modified: Fri, 16 Oct 2026 01:56:12 GMT. This page serves the committed last-good snapshot. The shared weekly refresh publishes validated versions atomically and retains the previous version on failure. Changed interpretation is flagged for review; imports do not advance the editorial review date. Local broker studies and photographs retain their own dates.
SHA-256: cf1ac2ab12236da3e05a81d06542e6fb95581704c6e9f375424e73b72ccb444b
Investment judgments are RentalCalcs’ analysis of the stated evidence. Purchase examples are explicitly assumed underwriting cases, not listings, appraisals, financing quotes or observed market cap rates. Report a correction.