State rent research · editorial review 2026-10-21
Average Rent in Colorado: ZIPs, Concessions & Rental Income
The median of 192 tracked Colorado ZIP rent indices is $1,969 per month for September 2026.
Equal weight per ZIP · all homes and bedrooms combined · derived from Zillow’s smoothed asking-rent indices; this ZIP series is not seasonally adjusted. This is not a provider-published statewide estimate, an average paid by tenants or a rent quote for a particular home.
Denver and Colorado Springs both absorbed more apartments than were delivered over the year ending Q2 2026, yet their reported effective rents were still below a year earlier. Improving leasing is not the same as recovering the face rent on every lease.

April 3, 2019 · Xnatedawgx · Original photograph · CC BY-SA 4.0. Resized and converted to WebP.

What the rent evidence changes for a rental decision
Compare the full lease consideration before paying for a recovery. Denver’s building vintages and Colorado Springs’ separate supply cycle require different comparable sets; resort and rural rentals need their own evidence beyond the Front Range surveys.
Denver provider apartment markets
Absorption can improve while annual rents are still falling
MMG reports 11,286 apartments absorbed against 9,717 completed over the four quarters ending Q2 2026, while effective rents declined 4.5% annually. CBRE separately reports 94.4% Q2 occupancy and a 5.5% annual decline in its average rent. Its inventory is not reconciled to MMG’s 91.2% stabilized occupancy.
The direction supports testing a recovery, but the level and speed depend on the inventory and rent definition. Averaging those occupancy percentages or calling their difference a trend would manufacture a result. Strong absorption can coexist with incentives needed to fill existing vacancies.
Decision. Reconcile face rent, free months and recurring fees for a directly competing unit. Budget the first lease at the income the written offer actually collects; test a later renewal separately rather than assuming today’s incentive disappears.
What could change it. Executed leases without renewed incentives and higher subject renewals would strengthen the recovery case. A regional absorption surge alone does not prove that an older walk-up can raise rents or absorb its capital work.
Records to obtain. Concession addenda, signed comparable leases, current availability, subject renewals and actual receivables.
Read the source reports
- MMG Denver Q2 2026 apartment report — Q2 2026; provider apartment inventory; flows trailing four quarters.
- CBRE Denver Multifamily Figures — Published July 21, 2026; Q2 2026; a separate provider inventory.
Denver building vintages
An older building’s discount can be consumed by service and capital costs
Northmarq identifies 1970s apartments as its highest-vacancy vintage and the only vintage with a quarterly rent decline in Q2. Its 1990s cohort has the lowest vacancy, 4.2%. The report also distinguishes about 11,100 unleased apartments from prospective 2027 completions.
A cheaper older apartment is not automatically insulated from new supply. Maintenance, utility responsibility and condition can erode its effective discount. Existing unleased apartments and future deliveries are different stocks and flows; adding them would not produce a current vacancy count.
Decision. For a renovation, compare the resident’s full recurring housing cost with similar renovated and unrenovated units. Price roof, systems and turnover work separately from recurring repairs, then test whether documented additional rent compensates for both downtime and capital.
What could change it. A well-maintained older unit serving a different price segment may face little direct new-build competition. The vintage average cannot determine the condition or occupancy of that subject.
Records to obtain. Component inspection, owner utility bills, maintenance history, resident fees and signed before/after-renovation comparables.
Read the source reports
- Northmarq Denver operating and vintage analysis — Published August 26, 2026; Q2 operating evidence; future deliveries are forecasts.
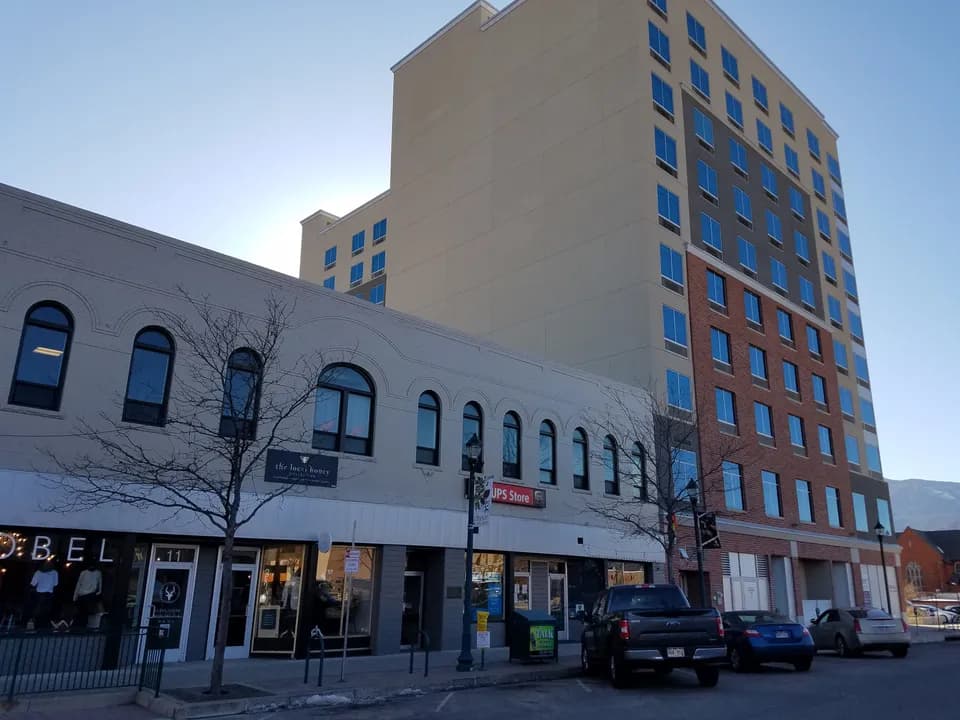
January 20, 2021 · Xnatedawgx · Original photograph · CC BY-SA 4.0. Resized and converted to WebP.

Colorado Springs apartment market
Colorado Springs’ smaller delivery wave does not justify importing Denver’s rent
MMG reports 2,508 units absorbed and 1,488 completed over the trailing year, with 90.5% occupancy. Q2 effective rent rose 0.9% sequentially but remained 1.9% below a year earlier. The quarterly gain and annual decline describe different comparisons.
Reduced delivery pressure makes an occupied existing property worth investigating, while the remaining vacancy argues for a slower stabilization case. Denver’s larger dollar rent or absorption total does not measure this market, and neither survey establishes seasonal mountain-town income.
Decision. For a Springs lease-up, compare the actual move-in month and unit type with nearby inventory. Require signed leases or current offers supporting the incentive assumed in the worksheet; do not escalate annual rent because one quarter improved.
What could change it. Scarce layouts or a strong renewal book may outperform; nearby incentives and a slower occupancy ramp can reverse the thesis. Resort rentals need a separate seasonality, permitted-use and operating model.
Records to obtain. Month-specific competitor offers, subject lease starts and renewals, lawful use and unit condition.
Read the source reports
- MMG Colorado Springs Q2 2026 apartment report — Q2 2026; flows trailing four quarters; effective apartment rents.
City and County of Denver
A Denver metro label does not establish the property’s rental regulator
Denver’s licensing program covers residential rentals offered for 30 days or more within the City and County of Denver. Its code generally requires verification of a successful inspection before approval, with stated exceptions. Aurora and other metro municipalities have their own jurisdictional review.
An otherwise attractive rent roll can require inspection work or a different first-income schedule. The metro survey’s geographic label cannot resolve the license status or legal unit count of an address.
Decision. Locate the parcel’s actual municipality, obtain the applicable license and inspection record, and price outstanding work before allocating first-year cash. Use the city’s current application/renewal guidance for the particular ownership and property situation.
What could change it. A valid license and documented compliant condition can reduce initial execution risk. An inspection exemption does not by itself establish exemption from every other operating requirement.
Records to obtain. Parcel jurisdiction, license status, inspection record, lawful unit count and funded repair scope.
Read the source reports
- Denver residential rental licensing — Municipal requirements reviewed October 21, 2026; City and County of Denver only.
- Denver Code Chapter 27: rental licensing and inspections — Current code reviewed October 21, 2026; inspection exceptions require separate review.
Hypothetical one-apartment offers · first 12 months · USD collected after 5% vacancy/noncollection
$1,850 × 11 paid months × 95% collection
$19,332.50
First-lease reference
$1,750 × 12 paid months × 95% collection
$19,950
$617.50 more than the reference over 12 months
$1,850 × 12 paid months × 95% collection
$21,090
$1,757.50 more than the reference over 12 months
| Measure | Value | Definition |
|---|---|---|
| $1,850 with one free month | 19,332.5 | $1,850 × 11 paid months × 95% collection; worksheet base case. |
| $1,750 without free rent | 19,950 | $1,750 × 12 paid months × 95%; same assumed collection loss and services. |
| $1,850 without free rent | 21,090 | A separate hypothetical lease with no incentive; not a renewal forecast. |
The lower face-rent offer collects $617.5 more over this assumed first year. Comparing only the two advertised monthly figures reverses the income ordering. Actual mandatory charges, utilities, moving costs and later lease terms can change a renter’s choice; owner expenses and downtime can change NOI. No source survey establishes that these offers are available.
Read the source reports
- MMG Denver Q2 2026 apartment report — Q2 2026; provider apartment inventory; flows trailing four quarters.
- MMG Colorado Springs Q2 2026 apartment report — Q2 2026; flows trailing four quarters; effective apartment rents.
Compare rents across these county groups
These analyst-selected sets use the listed county labels and the same September 2026 observation month. Each ZIP receives one equal vote. They are not official metro definitions, exhaustive regions or bedroom comparisons.
32 distinct county labels appear in the current sample; geographic coverage is incomplete and uneven. Only currently available observations from the same latest month enter these comparisons. Older retained records and missing ZIPs do not enter as zero rents.
| Comparison and exact membership | ZIP median | ZIP count |
|---|---|---|
| Denver core · Denver County Denver | $1,951 | 25 |
| Inner Front Range · three counties Adams, Arapahoe, Jefferson | $1,906 | 50 |
| Colorado Springs · El Paso County El Paso | $1,863 | 27 |
| Northern Front Range · two counties Larimer, Weld | $2,055 | 19 |
| Boulder County Boulder | $2,332 | 9 |
| Western Slope comparison · Mesa County Mesa | $1,736 | 9 |
Compare supported postal-city groups
City links require at least three current ZIP observations. Postal city labels are not legal municipal boundaries. Groups are ordered by coverage, then name; this is not an affordability ranking.
15 matching cities
| Postal city | ZIP median / month | ZIP mean / month | ZIP count |
|---|---|---|---|
| Denver | $1,910 | $1,904 | 27 |
| Colorado Springs | $1,695 | $1,780 | 20 |
| Aurora | $1,675 | $1,915 | 9 |
| Lakewood | $1,771 | $1,754 | 7 |
| Grand Junction | $1,859 | $1,865 | 6 |
| Pueblo | $1,289 | $1,373 | 6 |
| Boulder | $2,512 | $2,606 | 5 |
| Fort Collins | $2,050 | $1,993 | 5 |
Show 7 more city groups
| Postal city | ZIP median / month | ZIP mean / month | ZIP count |
|---|---|---|---|
| Littleton | $2,118 | $2,182 | 5 |
| Arvada | $1,965 | $2,062 | 4 |
| Centennial | $2,440 | $2,386 | 4 |
| Thornton | $1,787 | $2,035 | 4 |
| Westminster | $1,861 | $1,835 | 4 |
| Highlands Ranch | $2,781 | $2,639 | 3 |
| Longmont | $1,898 | $1,926 | 3 |
Find a ZIP rent observation
The table preserves each source ZIP, date and supplied county label. A ZIP can cross county or municipal boundaries; verify the actual address separately. No bedroom multiplier is applied.
192 matching ZIPs
| ZIP | Postal city | County label | Index / month | Observation |
|---|---|---|---|---|
| 80002 | Arvada | Jefferson County | $2,097 | September 2026 |
| 80003 | Arvada | Jefferson County | $1,772 | September 2026 |
| 80004 | Arvada | Jefferson County | $1,833 | September 2026 |
| 80005 | Arvada | Jefferson County | $2,547 | September 2026 |
| 80010 | Aurora | Arapahoe County | $1,543 | September 2026 |
| 80011 | Aurora | Arapahoe County | $1,675 | September 2026 |
| 80012 | Aurora | Arapahoe County | $1,541 | September 2026 |
| 80013 | Aurora | Arapahoe County | $1,911 | September 2026 |
| 80014 | Aurora | Arapahoe County | $1,599 | September 2026 |
| 80015 | Centennial | Arapahoe County | $2,679 | September 2026 |
Show 182 more ZIP observations
| ZIP | Postal city | County label | Index / month | Observation |
|---|---|---|---|---|
| 80016 | Aurora | Arapahoe County | $2,002 | September 2026 |
| 80017 | Aurora | Arapahoe County | $1,566 | September 2026 |
| 80018 | Aurora | Arapahoe County | $2,794 | September 2026 |
| 80019 | Aurora | Adams County | $2,606 | September 2026 |
| 80020 | Broomfield | Broomfield County | $2,196 | September 2026 |
| 80021 | Westminster | Jefferson County | $1,919 | September 2026 |
| 80022 | Commerce City | Adams County | $2,504 | September 2026 |
| 80023 | Broomfield | Broomfield County | $2,085 | September 2026 |
| 80026 | Lafayette | Boulder County | $2,200 | September 2026 |
| 80027 | Louisville | Boulder County | $2,284 | September 2026 |
| 80030 | Westminster | Adams County | $1,355 | September 2026 |
| 80031 | Westminster | Adams County | $2,264 | September 2026 |
| 80033 | Wheat Ridge | Jefferson County | $1,854 | September 2026 |
| 80104 | Castle Rock | Douglas County | $2,339 | September 2026 |
| 80108 | Castle Pines | Douglas County | $2,297 | September 2026 |
| 80109 | Castle Rock | Douglas County | $2,629 | September 2026 |
| 80110 | Sheridan | Arapahoe County | $1,602 | September 2026 |
| 80111 | Greenwood Village | Arapahoe County | $2,007 | September 2026 |
| 80112 | Centennial | Arapahoe County | $1,984 | September 2026 |
| 80113 | Cherry Hills Village | Arapahoe County | $1,900 | September 2026 |
| 80120 | Littleton | Arapahoe County | $1,946 | September 2026 |
| 80121 | Centennial | Arapahoe County | $2,477 | September 2026 |
| 80122 | Centennial | Arapahoe County | $2,402 | September 2026 |
| 80123 | Littleton | Denver County | $1,950 | September 2026 |
| 80124 | Lone Tree | Douglas County | $1,947 | September 2026 |
| 80125 | Littleton | Douglas County | $2,722 | September 2026 |
| 80126 | Highlands Ranch | Douglas County | $2,919 | September 2026 |
| 80127 | Littleton | Jefferson County | $2,118 | September 2026 |
| 80128 | Littleton | Jefferson County | $2,172 | September 2026 |
| 80129 | Highlands Ranch | Douglas County | $2,216 | September 2026 |
| 80130 | Highlands Ranch | Douglas County | $2,781 | September 2026 |
| 80132 | Monument | El Paso County | $2,112 | September 2026 |
| 80134 | Parker | Douglas County | $2,343 | September 2026 |
| 80138 | Parker | Douglas County | $1,994 | September 2026 |
| 80202 | Denver | Denver County | $2,013 | September 2026 |
| 80203 | Denver | Denver County | $1,582 | September 2026 |
| 80204 | Denver | Denver County | $1,951 | September 2026 |
| 80205 | Denver | Denver County | $2,010 | September 2026 |
| 80206 | Denver | Denver County | $1,858 | September 2026 |
| 80207 | Denver | Denver County | $2,389 | September 2026 |
| 80209 | Denver | Denver County | $2,200 | September 2026 |
| 80210 | Denver | Denver County | $2,019 | September 2026 |
| 80211 | Denver | Denver County | $2,186 | September 2026 |
| 80212 | Denver | Denver County | $2,487 | September 2026 |
| 80214 | Lakewood | Jefferson County | $1,541 | September 2026 |
| 80215 | Lakewood | Jefferson County | $1,729 | September 2026 |
| 80216 | Denver | Denver County | $1,910 | September 2026 |
| 80218 | Denver | Denver County | $1,489 | September 2026 |
| 80219 | Denver | Denver County | $2,161 | September 2026 |
| 80220 | Denver | Denver County | $1,704 | September 2026 |
| 80221 | Denver | Adams County | $1,865 | September 2026 |
| 80222 | Denver | Arapahoe County | $1,752 | September 2026 |
| 80223 | Denver | Denver County | $1,958 | September 2026 |
| 80224 | Denver | Denver County | $1,638 | September 2026 |
| 80226 | Lakewood | Jefferson County | $1,901 | September 2026 |
| 80227 | Lakewood | Jefferson County | $1,771 | September 2026 |
| 80228 | Lakewood | Jefferson County | $1,851 | September 2026 |
| 80229 | Thornton | Adams County | $1,633 | September 2026 |
| 80230 | Denver | Denver County | $1,888 | September 2026 |
| 80231 | Denver | Arapahoe County | $1,488 | September 2026 |
| 80232 | Lakewood | Jefferson County | $1,704 | September 2026 |
| 80233 | Thornton | Adams County | $1,652 | September 2026 |
| 80234 | Westminster | Adams County | $1,802 | September 2026 |
| 80235 | Lakewood | Jefferson County | $1,782 | September 2026 |
| 80236 | Denver | Denver County | $2,034 | September 2026 |
| 80237 | Denver | Denver County | $1,817 | September 2026 |
| 80238 | Denver | Denver County | $2,113 | September 2026 |
| 80239 | Denver | Denver County | $1,732 | September 2026 |
| 80241 | Thornton | Adams County | $1,921 | September 2026 |
| 80246 | Denver | Denver County | $1,360 | September 2026 |
| 80247 | Denver | Denver County | $1,824 | September 2026 |
| 80249 | Denver | Denver County | $1,971 | September 2026 |
| 80260 | Federal Heights | Adams County | $1,551 | September 2026 |
| 80301 | Boulder | Boulder County | $2,353 | September 2026 |
| 80302 | Boulder | Boulder County | $2,997 | September 2026 |
| 80303 | Boulder | Boulder County | $2,332 | September 2026 |
| 80304 | Boulder | Boulder County | $2,512 | September 2026 |
| 80305 | Boulder | Boulder County | $2,837 | September 2026 |
| 80401 | Golden | Jefferson County | $2,104 | September 2026 |
| 80403 | Golden | Jefferson County | $2,525 | September 2026 |
| 80424 | Breckenridge | Summit County | $3,554 | September 2026 |
| 80435 | Dillon | Summit County | $2,864 | September 2026 |
| 80439 | Evergreen | Jefferson County | $2,572 | September 2026 |
| 80442 | Fraser | Grand County | $2,400 | September 2026 |
| 80443 | Frisco | Summit County | $3,608 | September 2026 |
| 80446 | Granby | Grand County | $2,006 | September 2026 |
| 80452 | Idaho Springs | Clear Creek County | $2,150 | September 2026 |
| 80461 | Leadville | Lake County | $2,198 | September 2026 |
| 80465 | Morrison | Jefferson County | $2,880 | September 2026 |
| 80487 | Steamboat Springs | Routt County | $3,336 | September 2026 |
| 80498 | Silverthorne | Summit County | $3,495 | September 2026 |
| 80501 | Longmont | Boulder County | $1,797 | September 2026 |
| 80503 | Longmont | Boulder County | $1,898 | September 2026 |
| 80504 | Longmont | Weld County | $2,082 | September 2026 |
| 80513 | Berthoud | Larimer County | $2,679 | September 2026 |
| 80516 | Erie | Weld County | $2,772 | September 2026 |
| 80517 | Estes Park | Larimer County | $2,500 | September 2026 |
| 80521 | Fort Collins | Larimer County | $1,863 | September 2026 |
| 80524 | Fort Collins | Larimer County | $2,055 | September 2026 |
| 80525 | Fort Collins | Larimer County | $1,853 | September 2026 |
| 80526 | Fort Collins | Larimer County | $2,050 | September 2026 |
| 80528 | Fort Collins | Larimer County | $2,146 | September 2026 |
| 80534 | Johnstown | Weld County | $1,993 | September 2026 |
| 80537 | Loveland | Larimer County | $1,798 | September 2026 |
| 80538 | Loveland | Larimer County | $2,017 | September 2026 |
| 80547 | Timnath | Larimer County | $2,944 | September 2026 |
| 80549 | Wellington | Larimer County | $2,335 | September 2026 |
| 80550 | Windsor | Weld County | $2,196 | September 2026 |
| 80601 | Brighton | Adams County | $1,974 | September 2026 |
| 80602 | Thornton | Adams County | $2,934 | September 2026 |
| 80603 | Lochbuie | Weld County | $3,168 | September 2026 |
| 80620 | Evans | Weld County | $1,737 | September 2026 |
| 80631 | Greeley | Weld County | $1,297 | September 2026 |
| 80634 | Greeley | Weld County | $1,563 | September 2026 |
| 80640 | Commerce City | Adams County | $2,168 | September 2026 |
| 80723 | Brush | Morgan County | $1,292 | September 2026 |
| 80751 | Sterling | Logan County | $1,172 | September 2026 |
| 80808 | Calhan | El Paso County | $1,933 | September 2026 |
| 80813 | Cripple Creek | Teller County | $1,550 | September 2026 |
| 80817 | Fountain | El Paso County | $2,052 | September 2026 |
| 80829 | Manitou Springs | El Paso County | $1,390 | September 2026 |
| 80831 | Peyton | El Paso County | $2,686 | September 2026 |
| 80863 | Woodland Park | Teller County | $2,061 | September 2026 |
| 80903 | Colorado Springs | El Paso County | $1,708 | September 2026 |
| 80904 | Colorado Springs | El Paso County | $1,606 | September 2026 |
| 80905 | Colorado Springs | El Paso County | $1,477 | September 2026 |
| 80906 | Colorado Springs | El Paso County | $1,600 | September 2026 |
| 80907 | Colorado Springs | El Paso County | $1,565 | September 2026 |
| 80908 | Colorado Springs | El Paso County | $1,925 | September 2026 |
| 80909 | Colorado Springs | El Paso County | $1,276 | September 2026 |
| 80910 | Colorado Springs | El Paso County | $1,438 | September 2026 |
| 80911 | Security-Widefield | El Paso County | $2,256 | September 2026 |
| 80915 | Colorado Springs | El Paso County | $1,747 | September 2026 |
| 80916 | Colorado Springs | El Paso County | $1,518 | September 2026 |
| 80917 | Colorado Springs | El Paso County | $1,517 | September 2026 |
| 80918 | Colorado Springs | El Paso County | $1,550 | September 2026 |
| 80919 | Colorado Springs | El Paso County | $1,681 | September 2026 |
| 80920 | Colorado Springs | El Paso County | $1,890 | September 2026 |
| 80921 | Monument | El Paso County | $1,863 | September 2026 |
| 80922 | Colorado Springs | El Paso County | $2,030 | September 2026 |
| 80923 | Colorado Springs | El Paso County | $1,967 | September 2026 |
| 80924 | Colorado Springs | El Paso County | $1,961 | September 2026 |
| 80925 | Colorado Springs | El Paso County | $2,473 | September 2026 |
| 80927 | Colorado Springs | El Paso County | $2,205 | September 2026 |
| 80951 | Colorado Springs | El Paso County | $2,467 | September 2026 |
| 81001 | Pueblo | Pueblo County | $1,226 | September 2026 |
| 81003 | Pueblo | Pueblo County | $1,345 | September 2026 |
| 81004 | Pueblo | Pueblo County | $1,123 | September 2026 |
| 81005 | Pueblo | Pueblo County | $1,232 | September 2026 |
| 81007 | Pueblo | Pueblo County | $1,906 | September 2026 |
| 81008 | Pueblo | Pueblo County | $1,407 | September 2026 |
| 81082 | Trinidad | Las Animas County | $1,194 | September 2026 |
| 81101 | Alamosa | Alamosa County | $1,071 | September 2026 |
| 81122 | Bayfield | La Plata County | $2,433 | September 2026 |
| 81147 | Pagosa Springs | Archuleta County | $1,922 | September 2026 |
| 81201 | Salida | Chaffee County | $2,138 | September 2026 |
| 81211 | Buena Vista | Chaffee County | $1,913 | September 2026 |
| 81212 | Canon City | Fremont County | $1,371 | September 2026 |
| 81301 | Durango | La Plata County | $2,001 | September 2026 |
| 81303 | Durango | La Plata County | $1,796 | September 2026 |
| 81321 | Cortez | Montezuma County | $1,747 | September 2026 |
| 81401 | Montrose | Montrose County | $1,886 | September 2026 |
| 81416 | Delta | Delta County | $1,275 | September 2026 |
| 81501 | Grand Junction | Mesa County | $1,499 | September 2026 |
| 81503 | Grand Junction | Mesa County | $1,839 | September 2026 |
| 81504 | Grand Junction | Mesa County | $2,021 | September 2026 |
| 81505 | Grand Junction | Mesa County | $1,879 | September 2026 |
| 81506 | Grand Junction | Mesa County | $1,736 | September 2026 |
| 81507 | Grand Junction | Mesa County | $2,215 | September 2026 |
| 81520 | Clifton | Mesa County | $1,385 | September 2026 |
| 81521 | Fruita | Mesa County | $1,664 | September 2026 |
| 81526 | Palisade | Mesa County | $1,571 | September 2026 |
| 81601 | Glenwood Springs | Garfield County | $2,541 | September 2026 |
| 81611 | Aspen | Pitkin County | $17,626 | September 2026 |
| 81620 | Avon | Eagle County | $3,325 | September 2026 |
| 81621 | Basalt | Eagle County | $4,225 | September 2026 |
| 81623 | Carbondale | Garfield County | $4,001 | September 2026 |
| 81631 | Eagle | Eagle County | $3,031 | September 2026 |
| 81632 | Edwards | Eagle County | $4,333 | September 2026 |
| 81637 | Gypsum | Eagle County | $2,698 | September 2026 |
| 81647 | New Castle | Garfield County | $2,500 | September 2026 |
| 81657 | Vail | Eagle County | $5,219 | September 2026 |
Separate first-lease incentives from continuing rent
Hypothetical assumptions: $1,850 monthly rent, 5% annual vacancy/noncollection, one free month, $7,200 recurring operating costs, $10,800 debt service and $1,200 reserves per apartment. The rent is an editable scenario, not a Colorado benchmark automatically assigned to a property.
Initial calculated result: $19,333 collected rent, $12,133 NOI before debt/reserves, and $133 cash after debt/reserves. Change the assumptions below to test your own budget.
Illustration · one apartment · first 12 months · USD. Editable assumptions, not observed market averages or an acquisition recommendation. All recurring amounts are allocated per apartment. No appreciation, sale proceeds or tax benefits are assumed.
Annual cash after operating costs, debt and reserve contribution
$133This is a positive illustration margin, before initial capital work, income tax and sale costs.
- Scheduled rent
- $22,200
- − Vacancy / noncollection
- -$1,110
- − Occupied-share concession
- -$1,758
- = Effective rental income
- $19,333
- − Operating expenses
- -$7,200
- = NOI before debt / reserves
- $12,133
- − Debt service
- -$10,800
- − Reserve contribution
- -$1,200
- = Annual cash margin
- $133
NOI excludes debt service and this worksheet’s reserve contribution. Initial renovation, acquisition costs and initial downtime are outside this annual operating illustration. Do not subtract the same vacancy, incentive or repair expense twice.
On a narrow screen, scroll the table sideways to compare all three expense budgets.
| Collected occupancy | Entered expenses | Expenses +10% | Expenses +20% |
|---|---|---|---|
| 95% | $133Cash remaining | -$588Cash deficit | -$1,308Cash deficit |
| 90% | -$885Cash deficit | -$1,605Cash deficit | -$2,325Cash deficit |
| 85% | -$1,903Cash deficit | -$2,623Cash deficit | -$3,343Cash deficit |
Occupancy here is the collected share of scheduled rent before incentives, not a count of occupied doors. At the entered costs, break-even collected occupancy is 94.3%. Debt-service coverage is 1.12× NOI / debt service; it excludes reserve contributions.
This first lease leaves about $133 annual cash. At $1,750 with no free month, the same cost budget leaves $750. At $1,850 without an incentive it leaves $1,890, but that is another scenario, not a promised renewal. Test whether current signed leases support the concession, and fund initial repairs separately.
Use the full property cash-flow calculator for the purchase price, financing terms and holding period. Review its expense and reserve conventions before transferring assumptions; this illustration does not automatically populate a deal.
Colorado rent questions
Is the Colorado headline a typical Denver apartment rent?
No. The headline is our median of covered Colorado ZIP indices, across all home sizes and types. Denver apartment surveys and Colorado Springs apartment surveys have separate inventories and periods.
Can rent be recovering while the annual change is negative?
Yes. Colorado Springs’ cited Q2 effective rent rose from the prior quarter while remaining below the same quarter a year earlier. Use the exact comparison period rather than calling either number the entire trend.
How should I compare one free month with a lower monthly rent?
Compare the full lease term and paid months, then include mandatory charges, utilities and other costs. The figure uses the shared income engine and equal collection assumptions. A future renewal is a separate decision.
How these rent figures are calculated
State: Colorado · USPS CO · Census state FIPS 08. Zillow supplies postal ZIP observations with city and county labels. We filter to valid positive rents in this state and the latest common observation month, sort the values, and take the middle value, or the mean of the two middle values for an even count. Means are the sum divided by included ZIPs. No population, household or rental-unit weighting is added.
The all-home, all-bedroom ZIP series is smoothed, not seasonally adjusted. A bedroom rent cannot be inferred from it. Membership can change after a refresh, so a change in this page’s median is not a matched-sample rent-growth rate. This edition does not publish a ZIP-sample growth claim.
Data: Zillow Research · ZORI method · National ZIP source CSV. The state benchmark is our ZIP-based calculation, not a provider-published statewide estimate. Occupied-unit Census rent, listing medians, effective broker rents and HUD gross-rent references answer different questions and are not blended here.
The observation month identifies the rent data available for this comparison. Historical or missing latest observations stay out of the current sample. Check the date before comparing a property with a newly advertised offer.
Market and legal sources below were reviewed 2026-10-21. Their own periods are shown next to each claim. Broker samples and boundaries are not fully disclosed; surveys may share underlying providers and should not be treated as independent experiments. The market interpretation is conditional research, not a property-level income guarantee. Recheck local rules, signed comparable leases and actual expenses before using an illustration in a transaction.
Read the source reports
- MMG Denver Q2 2026 apartment report — Q2 2026; provider apartment inventory; flows trailing four quarters.
- CBRE Denver Multifamily Figures — Published July 21, 2026; Q2 2026; a separate provider inventory.
- Northmarq Denver operating and vintage analysis — Published August 26, 2026; Q2 operating evidence; future deliveries are forecasts.
- MMG Colorado Springs Q2 2026 apartment report — Q2 2026; flows trailing four quarters; effective apartment rents.
- Denver residential rental licensing — Municipal requirements reviewed October 21, 2026; City and County of Denver only.
- Denver Code Chapter 27: rental licensing and inspections — Current code reviewed October 21, 2026; inspection exceptions require separate review.