State rent research · editorial review 2026-10-24
Average Rent in Massachusetts: ZIPs, Leasing & First-Lease Cash
The median of 204 tracked Massachusetts ZIP rent indices is $2,735 per month for September 2026.
Equal weight per ZIP · all homes and bedrooms combined · derived from Zillow’s smoothed asking-rent indices; this ZIP series is not seasonally adjusted. This is not a provider-published statewide estimate, an average paid by tenants or a rent quote for a particular home.
Greater Boston’s tightening apartment market does not remove concessions or first-lease costs. Cambridge’s constrained supply and Worcester’s property-registration checks lead to different records. A landlord-hired broker fee can turn a positive recurring cash budget into a first-lease deficit.
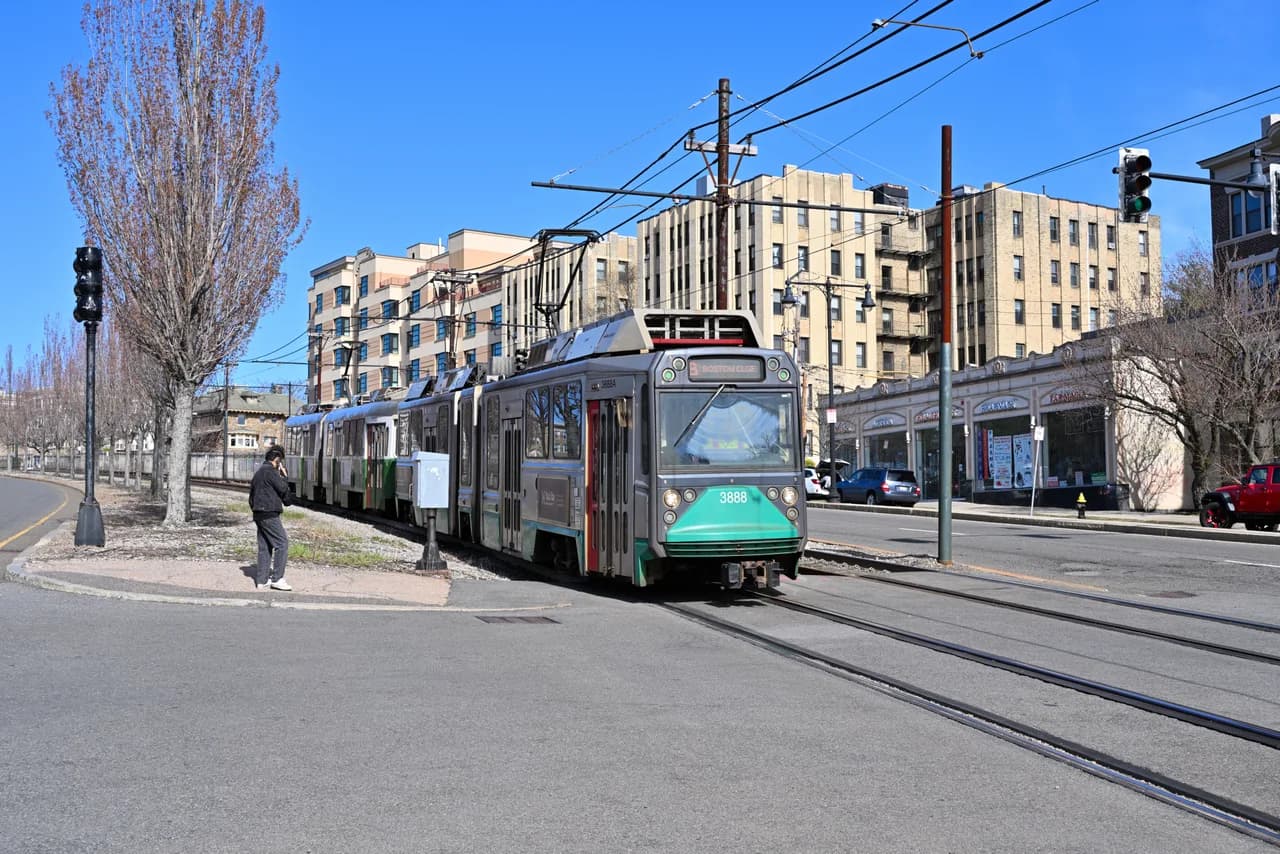
April 2025 · 4300streetcar · Original photograph · CC BY 4.0. Resized and converted to WebP.

What the rent evidence changes for a rental decision
Use the ZIP benchmark to choose where to investigate, not to price an unmatched apartment. In Greater Boston verify the net lease offer; in Worcester confirm the property and lawful units; across Massachusetts identify who engaged the broker and budget the owner’s actual agreed fee separately from recurring NOI.
Greater Boston and Cambridge apartments
Tighter occupancy supports a lease investigation, not automatic concession removal
Colliers’ October 22 Q3 2026 report summary puts Greater Boston vacancy at 5.7%, down 30 basis points in the quarter, and annual rent growth at 2.2%. Cambridge vacancy is 4.1% with 3.6% annual rent growth. The summary also reports Cambridge concessions of 3.4%, above its 1.6% historical average.
The Cambridge result supports examining limited competing supply, but a remaining incentive means headline growth and net first-lease income can diverge. Publisher apartment geography and inventory are not the same as a postal-city ZIP group or an older three-unit building. The public summary does not establish a matched small-property rent.
Decision. Compare the subject’s full lease term, free rent, mandatory charges and renewal dates with signed offers for the same layout and location. Keep a continuing-incentive case until receipts support burn-off. Use the published Boston metro guide for finer local research.
What could change it. A scarce layout with full-price signed renewals can outperform the survey. A different location, deferred work or a nearby lease-up can offset the supply advantage; the current quarter does not lock in future rent growth.
Records to obtain. Executed comparable leases, itemized incentives and charges, subject renewals, collection history and current competing availability.
Read the source reports
- Colliers Greater Boston Multifamily Report Q3 2026 — Published October 22, 2026; Q3 2026 publisher-defined multifamily market and Cambridge submarket; public report summary accessed October 24, 2026; not a small-building matched sample.
Worcester small rental buildings
A registered property and a rent-ready lawful unit answer different questions
Worcester’s current owner guidance requires all rental properties in the city to be registered annually, with updated owner and property-manager contact details. This is a city program, not a requirement established by the Greater Boston market report.
A familiar three-decker layout does not by itself establish the legal unit count, completed permitted work or a first-payment date. Registration is an important record to reconcile, but its presence alone cannot substitute for a condition and lawful-use investigation.
Decision. Match the registry entry to the parcel, owner and management contact. Obtain the building’s lawful-unit and outstanding-work records before counting every advertised unit in year-one collections. Schedule repairs and leasing from the documented condition.
What could change it. A current entry with verified lawful units and completed work can reduce uncertainty. An annual registration submission without those records leaves the income start and repair budget unresolved.
Records to obtain. Current city registry entry, parcel identity, lawful-unit records, permits, inspection or violation records and funded repair scope.
Read the source reports
- Worcester information for property owners — Current municipal rental-registry guidance reviewed October 24, 2026; City of Worcester only.
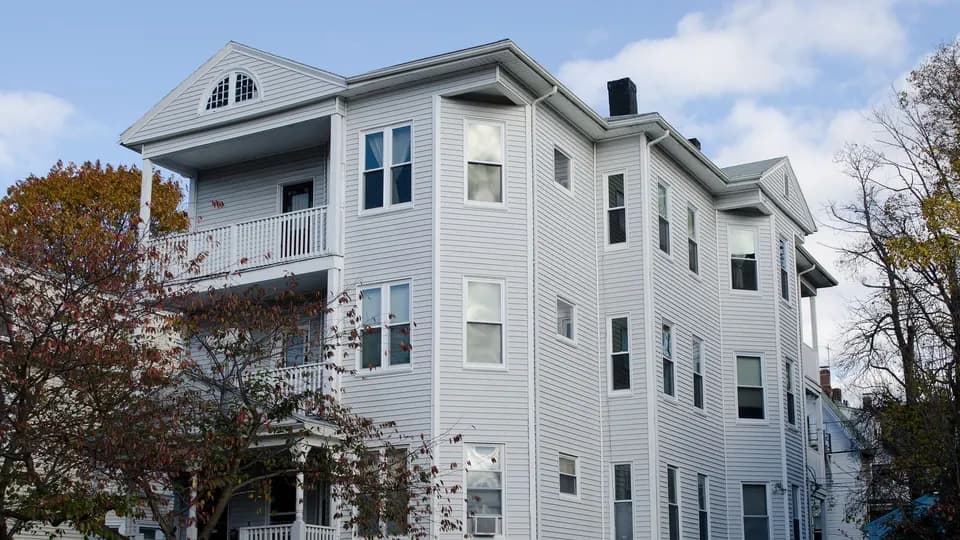
November 2012 · Tim Pierce · Original photograph · CC BY-SA 3.0. Resized and converted to WebP.

Massachusetts residential broker engagement
Who hires the broker determines whose fee needs a cash budget
The current version of M.G.L. c.112 §87DDD½, effective August 1, 2025, assigns the fee to the landlord or tenant who originally engaged and contracted with the licensed broker or salesperson. A landlord-hired broker’s fee cannot simply be assumed payable by an unhiring tenant. The statute does not set the one-month fee used below.
An owner’s placement fee may be a real first-lease cash use even when recurring NOI looks adequate. Treating it as free because the tenant paid a past fee overstates available cash; silently treating a one-time cost as recurring NOI also obscures the comparison.
Decision. Read the actual brokerage engagement and agreed compensation before the offer. In the illustration, subtract the assumed $3,000 one-time fee from $1,620 recurring cash after debt and reserves, producing a $1,380 first-lease deficit. Hold separate cash for repairs and deposits as applicable.
What could change it. Self-leasing or a different negotiated fee can change the cost, and a tenant may separately engage their own broker. Repeat turnover or leasing costs need a deliberate longer-term budget rather than assuming this first-lease illustration recurs unchanged every year.
Records to obtain. Signed broker engagement, who engaged whom, compensation agreement, current lease, turnover schedule and initial cash budget.
Read the source reports
- Massachusetts General Laws c.112 §87DDD½ — Current statutory text effective August 1, 2025, as amended by 2025 c.9 §43; reviewed October 24, 2026.
Hypothetical one apartment · first 12 months · USD · one-time $3,000 fee is an assumption, not a legal fee schedule
Recurring annual NOI · $22,620
After debt and reserves · $1,620
Less assumed one-time owner-hired broker fee · − $3,000
First-lease cash · −$1,380
The fee changes this first-lease cash case. It does not change the recurring NOI above. Budget repeat turnover costs separately over the intended holding period.
| Measure | Value | Definition |
|---|---|---|
| Collected rent | 33,120 | $3,000 × 11.5 paid months × 96%; shared worksheet assumptions. |
| Recurring NOI | 22,620 | Collected rent less $10,500 operating costs; before debt, reserves and the one-time placement fee. |
| Cash after debt and reserves | 1,620 | NOI less $19,500 debt and $1,500 reserves. |
| Assumed one-time owner-hired broker fee | 3,000 | One month of assumed face rent, negotiated for this example; outside recurring NOI. |
| First-lease cash after that fee | -1,380 | Recurring cash less the one-time fee; before initial repairs and other acquisition cash uses. |
The fee threshold is $1,620 in this example: above it, the illustrated first-lease cash becomes negative. It does not alter the $22,620 recurring NOI. If turnover makes placement costs recurring in the intended holding period, model their frequency explicitly. The statute determines who pays an engaged broker; it does not promise a tenant, occupancy or a fee amount.
Read the source reports
- Massachusetts General Laws c.112 §87DDD½ — Current statutory text effective August 1, 2025, as amended by 2025 c.9 §43; reviewed October 24, 2026.
Compare rents across these county groups
These analyst-selected sets use the listed county labels and the same September 2026 observation month. Each ZIP receives one equal vote. They are not official metro definitions, exhaustive regions or bedroom comparisons.
12 distinct county labels appear in the current sample; geographic coverage is incomplete and uneven. Only currently available observations from the same latest month enter these comparisons. Older retained records and missing ZIPs do not enter as zero rents.
| Comparison and exact membership | ZIP median | ZIP count |
|---|---|---|
| Boston-area county set Suffolk, Middlesex, Norfolk | $2,971 | 113 |
| Worcester County Worcester | $2,101 | 24 |
| North Shore · Essex County Essex | $2,694 | 24 |
| Pioneer Valley county set Hampden, Hampshire, Franklin | $1,940 | 13 |
| Cape Cod · Barnstable County Barnstable | $2,500 | 3 |
Compare supported postal-city groups
City links require at least three current ZIP observations. Postal city labels are not legal municipal boundaries. Groups are ordered by coverage, then name; this is not an affordability ranking.
14 matching cities
| Postal city | ZIP median / month | ZIP mean / month | ZIP count |
|---|---|---|---|
| Boston | $3,200 | $3,421 | 27 |
| Worcester | $2,152 | $2,111 | 8 |
| Cambridge | $3,379 | $3,504 | 5 |
| Newton | $3,155 | $3,516 | 5 |
| Fall River | $1,896 | $1,882 | 4 |
| Lowell | $2,208 | $2,239 | 4 |
| Brookline | $3,518 | $3,563 | 3 |
| Haverhill | $2,306 | $2,295 | 3 |
Show 6 more city groups
| Postal city | ZIP median / month | ZIP mean / month | ZIP count |
|---|---|---|---|
| Lynn | $2,302 | $2,374 | 3 |
| Quincy | $2,687 | $2,601 | 3 |
| Somerville | $3,238 | $3,493 | 3 |
| Springfield | $1,940 | $1,853 | 3 |
| Waltham | $2,806 | $2,953 | 3 |
| Weymouth | $2,592 | $2,556 | 3 |
Find a ZIP rent observation
The table preserves each source ZIP, date and supplied county label. A ZIP can cross county or municipal boundaries; verify the actual address separately. No bedroom multiplier is applied.
204 matching ZIPs
| ZIP | Postal city | County label | Index / month | Observation |
|---|---|---|---|---|
| 01002 | Amherst | Hampshire County | $2,957 | September 2026 |
| 01013 | Chicopee | Hampden County | $1,678 | September 2026 |
| 01020 | Chicopee | Hampden County | $1,696 | September 2026 |
| 01027 | Easthampton | Hampshire County | $2,206 | September 2026 |
| 01040 | Holyoke | Hampden County | $1,663 | September 2026 |
| 01060 | Northampton | Hampshire County | $2,355 | September 2026 |
| 01085 | Westfield | Hampden County | $1,950 | September 2026 |
| 01089 | West Springfield | Hampden County | $1,684 | September 2026 |
| 01103 | Springfield | Hampden County | $1,527 | September 2026 |
| 01108 | Springfield | Hampden County | $1,940 | September 2026 |
Show 194 more ZIP observations
| ZIP | Postal city | County label | Index / month | Observation |
|---|---|---|---|---|
| 01109 | Springfield | Hampden County | $2,091 | September 2026 |
| 01201 | Pittsfield | Berkshire County | $1,545 | September 2026 |
| 01238 | Lee | Berkshire County | $1,850 | September 2026 |
| 01301 | Greenfield | Franklin County | $2,089 | September 2026 |
| 01331 | Athol | Worcester County | $1,438 | September 2026 |
| 01364 | Orange | Franklin County | $1,550 | September 2026 |
| 01420 | Fitchburg | Worcester County | $1,859 | September 2026 |
| 01432 | Ayer | Middlesex County | $2,433 | September 2026 |
| 01440 | Gardner | Worcester County | $1,676 | September 2026 |
| 01453 | Leominster | Worcester County | $1,885 | September 2026 |
| 01460 | Littleton | Middlesex County | $2,549 | September 2026 |
| 01501 | Auburn | Worcester County | $2,534 | September 2026 |
| 01503 | Berlin | Worcester County | $2,752 | September 2026 |
| 01510 | Clinton | Worcester County | $1,990 | September 2026 |
| 01524 | Leicester | Worcester County | $1,900 | September 2026 |
| 01527 | Millbury | Worcester County | $2,459 | September 2026 |
| 01532 | Northborough | Worcester County | $2,979 | September 2026 |
| 01545 | Shrewsbury | Worcester County | $2,350 | September 2026 |
| 01550 | Southbridge | Worcester County | $1,763 | September 2026 |
| 01562 | Spencer | Worcester County | $1,824 | September 2026 |
| 01570 | Webster | Worcester County | $1,837 | September 2026 |
| 01581 | Westborough | Worcester County | $2,526 | September 2026 |
| 01602 | Worcester | Worcester County | $2,218 | September 2026 |
| 01603 | Worcester | Worcester County | $2,073 | September 2026 |
| 01604 | Worcester | Worcester County | $2,175 | September 2026 |
| 01605 | Worcester | Worcester County | $2,272 | September 2026 |
| 01606 | Worcester | Worcester County | $2,221 | September 2026 |
| 01608 | Worcester | Worcester County | $1,875 | September 2026 |
| 01609 | Worcester | Worcester County | $1,928 | September 2026 |
| 01610 | Worcester | Worcester County | $2,128 | September 2026 |
| 01701 | Framingham | Middlesex County | $2,823 | September 2026 |
| 01702 | Framingham | Middlesex County | $2,221 | September 2026 |
| 01720 | Acton | Middlesex County | $2,408 | September 2026 |
| 01721 | Ashland | Middlesex County | $2,820 | September 2026 |
| 01730 | Bedford | Middlesex County | $3,154 | September 2026 |
| 01742 | Concord | Middlesex County | $3,122 | September 2026 |
| 01748 | Hopkinton | Middlesex County | $2,842 | September 2026 |
| 01749 | Hudson | Middlesex County | $2,558 | September 2026 |
| 01752 | Marlborough | Middlesex County | $2,666 | September 2026 |
| 01754 | Maynard | Middlesex County | $2,453 | September 2026 |
| 01757 | Milford | Worcester County | $2,281 | September 2026 |
| 01760 | Natick | Middlesex County | $2,930 | September 2026 |
| 01778 | Wayland | Middlesex County | $3,741 | September 2026 |
| 01801 | Woburn | Middlesex County | $2,841 | September 2026 |
| 01803 | Burlington | Middlesex County | $3,145 | September 2026 |
| 01810 | Andover | Essex County | $2,767 | September 2026 |
| 01821 | Billerica | Middlesex County | $2,746 | September 2026 |
| 01824 | Chelmsford | Middlesex County | $2,655 | September 2026 |
| 01826 | Dracut | Middlesex County | $2,230 | September 2026 |
| 01830 | Haverhill | Essex County | $2,306 | September 2026 |
| 01832 | Haverhill | Essex County | $2,009 | September 2026 |
| 01835 | Haverhill | Essex County | $2,570 | September 2026 |
| 01840 | Lawrence | Essex County | $2,342 | September 2026 |
| 01843 | Lawrence | Essex County | $2,375 | September 2026 |
| 01844 | Methuen | Essex County | $2,352 | September 2026 |
| 01845 | North Andover | Essex County | $2,816 | September 2026 |
| 01850 | Lowell | Middlesex County | $2,197 | September 2026 |
| 01851 | Lowell | Middlesex County | $2,361 | September 2026 |
| 01852 | Lowell | Middlesex County | $2,179 | September 2026 |
| 01854 | Lowell | Middlesex County | $2,219 | September 2026 |
| 01863 | Chelmsford | Middlesex County | $2,787 | September 2026 |
| 01867 | Reading | Middlesex County | $2,888 | September 2026 |
| 01876 | Tewksbury | Middlesex County | $2,864 | September 2026 |
| 01879 | Tyngsboro | Middlesex County | $2,950 | September 2026 |
| 01880 | Wakefield | Middlesex County | $2,823 | September 2026 |
| 01886 | Westford | Middlesex County | $3,055 | September 2026 |
| 01887 | Wilmington | Middlesex County | $3,162 | September 2026 |
| 01890 | Winchester | Middlesex County | $3,246 | September 2026 |
| 01901 | Lynn | Essex County | $2,278 | September 2026 |
| 01902 | Lynn | Essex County | $2,302 | September 2026 |
| 01905 | Lynn | Essex County | $2,543 | September 2026 |
| 01906 | Saugus | Essex County | $3,139 | September 2026 |
| 01907 | Swampscott | Essex County | $3,536 | September 2026 |
| 01913 | Amesbury | Essex County | $2,500 | September 2026 |
| 01915 | Beverly | Essex County | $2,745 | September 2026 |
| 01923 | Danvers | Essex County | $2,825 | September 2026 |
| 01930 | Gloucester | Essex County | $2,705 | September 2026 |
| 01940 | Lynnfield | Essex County | $2,961 | September 2026 |
| 01945 | Marblehead | Essex County | $2,967 | September 2026 |
| 01950 | Newburyport | Essex County | $2,934 | September 2026 |
| 01952 | Salisbury | Essex County | $2,393 | September 2026 |
| 01960 | Peabody | Essex County | $2,836 | September 2026 |
| 01966 | Rockport | Essex County | $2,706 | September 2026 |
| 01970 | Salem | Essex County | $2,683 | September 2026 |
| 02019 | Bellingham | Norfolk County | $2,519 | September 2026 |
| 02021 | Canton | Norfolk County | $2,998 | September 2026 |
| 02025 | Cohasset | Norfolk County | $4,131 | September 2026 |
| 02026 | Dedham | Norfolk County | $2,913 | September 2026 |
| 02035 | Foxborough | Norfolk County | $2,655 | September 2026 |
| 02038 | Franklin | Norfolk County | $2,534 | September 2026 |
| 02043 | Hingham | Plymouth County | $3,852 | September 2026 |
| 02048 | Mansfield | Bristol County | $2,630 | September 2026 |
| 02050 | Marshfield | Plymouth County | $2,520 | September 2026 |
| 02062 | Norwood | Norfolk County | $2,579 | September 2026 |
| 02072 | Stoughton | Norfolk County | $2,520 | September 2026 |
| 02081 | Walpole | Norfolk County | $2,744 | September 2026 |
| 02090 | Westwood | Norfolk County | $3,318 | September 2026 |
| 02093 | Wrentham | Norfolk County | $2,647 | September 2026 |
| 02108 | Boston | Suffolk County | $3,869 | September 2026 |
| 02109 | Boston | Suffolk County | $3,757 | September 2026 |
| 02111 | Boston | Suffolk County | $3,921 | September 2026 |
| 02113 | Boston | Suffolk County | $2,868 | September 2026 |
| 02114 | Boston | Suffolk County | $3,670 | September 2026 |
| 02115 | Boston | Suffolk County | $3,185 | September 2026 |
| 02116 | Boston | Suffolk County | $3,412 | September 2026 |
| 02118 | Boston | Suffolk County | $3,805 | September 2026 |
| 02119 | Boston | Suffolk County | $3,200 | September 2026 |
| 02120 | Boston | Suffolk County | $3,743 | September 2026 |
| 02121 | Boston | Suffolk County | $3,228 | September 2026 |
| 02122 | Boston | Suffolk County | $3,134 | September 2026 |
| 02124 | Boston | Suffolk County | $3,045 | September 2026 |
| 02125 | Boston | Suffolk County | $3,160 | September 2026 |
| 02126 | Boston | Suffolk County | $2,971 | September 2026 |
| 02127 | Boston | Suffolk County | $3,738 | September 2026 |
| 02128 | Boston | Suffolk County | $3,111 | September 2026 |
| 02129 | Boston | Suffolk County | $3,500 | September 2026 |
| 02130 | Boston | Suffolk County | $3,112 | September 2026 |
| 02131 | Boston | Suffolk County | $2,874 | September 2026 |
| 02132 | Boston | Suffolk County | $2,830 | September 2026 |
| 02134 | Boston | Suffolk County | $2,934 | September 2026 |
| 02135 | Boston | Suffolk County | $2,914 | September 2026 |
| 02136 | Boston | Suffolk County | $2,806 | September 2026 |
| 02138 | Cambridge | Middlesex County | $3,205 | September 2026 |
| 02139 | Cambridge | Middlesex County | $3,379 | September 2026 |
| 02140 | Cambridge | Middlesex County | $3,360 | September 2026 |
| 02141 | Cambridge | Middlesex County | $3,650 | September 2026 |
| 02142 | Cambridge | Middlesex County | $3,925 | September 2026 |
| 02143 | Somerville | Middlesex County | $3,176 | September 2026 |
| 02144 | Somerville | Middlesex County | $4,065 | September 2026 |
| 02145 | Somerville | Middlesex County | $3,238 | September 2026 |
| 02148 | Malden | Middlesex County | $2,926 | September 2026 |
| 02149 | Everett | Middlesex County | $2,805 | September 2026 |
| 02150 | Chelsea | Suffolk County | $2,630 | September 2026 |
| 02151 | Revere | Suffolk County | $2,767 | September 2026 |
| 02152 | Winthrop | Suffolk County | $2,725 | September 2026 |
| 02155 | Medford | Middlesex County | $3,663 | September 2026 |
| 02169 | Quincy | Norfolk County | $2,687 | September 2026 |
| 02170 | Quincy | Norfolk County | $2,266 | September 2026 |
| 02171 | Quincy | Norfolk County | $2,851 | September 2026 |
| 02176 | Melrose | Middlesex County | $3,031 | September 2026 |
| 02180 | Stoneham | Middlesex County | $3,053 | September 2026 |
| 02184 | Braintree | Norfolk County | $2,927 | September 2026 |
| 02186 | Milton | Norfolk County | $3,625 | September 2026 |
| 02188 | Weymouth | Norfolk County | $2,343 | September 2026 |
| 02189 | Weymouth | Norfolk County | $2,592 | September 2026 |
| 02190 | Weymouth | Norfolk County | $2,733 | September 2026 |
| 02199 | Boston | Suffolk County | $5,930 | September 2026 |
| 02210 | Boston | Suffolk County | $4,455 | September 2026 |
| 02215 | Boston | Suffolk County | $3,203 | September 2026 |
| 02301 | Brockton | Plymouth County | $2,239 | September 2026 |
| 02302 | Brockton | Plymouth County | $2,450 | September 2026 |
| 02324 | Bridgewater | Plymouth County | $2,650 | September 2026 |
| 02339 | Hanover | Plymouth County | $2,888 | September 2026 |
| 02346 | Middleborough | Plymouth County | $2,171 | September 2026 |
| 02351 | Abington | Plymouth County | $2,679 | September 2026 |
| 02359 | Pembroke | Plymouth County | $2,730 | September 2026 |
| 02360 | Plymouth | Plymouth County | $2,801 | September 2026 |
| 02364 | Kingston | Plymouth County | $2,737 | September 2026 |
| 02368 | Randolph | Norfolk County | $2,582 | September 2026 |
| 02382 | Whitman | Plymouth County | $2,474 | September 2026 |
| 02420 | Lexington | Middlesex County | $4,108 | September 2026 |
| 02421 | Lexington | Middlesex County | $3,253 | September 2026 |
| 02445 | Brookline | Norfolk County | $3,439 | September 2026 |
| 02446 | Brookline | Norfolk County | $3,518 | September 2026 |
| 02451 | Waltham | Middlesex County | $3,271 | September 2026 |
| 02452 | Waltham | Middlesex County | $2,781 | September 2026 |
| 02453 | Waltham | Middlesex County | $2,806 | September 2026 |
| 02458 | Newton | Middlesex County | $2,954 | September 2026 |
| 02459 | Newton | Middlesex County | $4,115 | September 2026 |
| 02461 | Newton | Middlesex County | $4,254 | September 2026 |
| 02464 | Newton | Middlesex County | $3,100 | September 2026 |
| 02465 | Newton | Middlesex County | $3,155 | September 2026 |
| 02467 | Brookline | Norfolk County | $3,731 | September 2026 |
| 02472 | Watertown | Middlesex County | $3,101 | September 2026 |
| 02474 | Arlington | Middlesex County | $2,676 | September 2026 |
| 02476 | Arlington | Middlesex County | $3,132 | September 2026 |
| 02478 | Belmont | Middlesex County | $3,059 | September 2026 |
| 02494 | Needham | Norfolk County | $3,339 | September 2026 |
| 02536 | Falmouth | Barnstable County | $2,165 | September 2026 |
| 02571 | Wareham | Plymouth County | $2,400 | September 2026 |
| 02601 | Barnstable | Barnstable County | $2,808 | September 2026 |
| 02639 | Dennis | Barnstable County | $2,500 | September 2026 |
| 02703 | Attleboro | Bristol County | $2,366 | September 2026 |
| 02720 | Fall River | Bristol County | $1,950 | September 2026 |
| 02721 | Fall River | Bristol County | $1,842 | September 2026 |
| 02723 | Fall River | Bristol County | $1,778 | September 2026 |
| 02724 | Fall River | Bristol County | $1,957 | September 2026 |
| 02726 | Somerset | Bristol County | $2,050 | September 2026 |
| 02740 | New Bedford | Bristol County | $1,809 | September 2026 |
| 02744 | New Bedford | Bristol County | $1,598 | September 2026 |
| 02748 | Dartmouth | Bristol County | $2,649 | September 2026 |
| 02760 | North Attleboro | Bristol County | $2,221 | September 2026 |
| 02762 | Plainville | Norfolk County | $2,273 | September 2026 |
| 02780 | Taunton | Bristol County | $2,050 | September 2026 |
Separate recurring rent performance from first-lease cash needs
Hypothetical apartment: $3,000 rent, 4% annual vacancy/noncollection, half a free month, $10,500 operating costs, $19,500 debt and $1,500 reserves. These inputs are not a Massachusetts or Boston property estimate. The worksheet returns recurring income and cash; the separate figure subtracts the assumed one-time broker fee. Initial repairs, acquisition cash and refundable deposits require their own treatment.
Initial calculated result: $33,120 collected rent, $22,620 NOI before debt/reserves, and $1,620 cash after debt/reserves. Change the assumptions below to test your own budget.
Illustration · one apartment · first 12 months · USD. Editable assumptions, not observed market averages or an acquisition recommendation. All recurring amounts are allocated per apartment. No appreciation, sale proceeds or tax benefits are assumed.
Annual cash after operating costs, debt and reserve contribution
$1,620This is a positive illustration margin, before initial capital work, income tax and sale costs.
- Scheduled rent
- $36,000
- − Vacancy / noncollection
- -$1,440
- − Occupied-share concession
- -$1,440
- = Effective rental income
- $33,120
- − Operating expenses
- -$10,500
- = NOI before debt / reserves
- $22,620
- − Debt service
- -$19,500
- − Reserve contribution
- -$1,500
- = Annual cash margin
- $1,620
NOI excludes debt service and this worksheet’s reserve contribution. Initial renovation, acquisition costs and initial downtime are outside this annual operating illustration. Do not subtract the same vacancy, incentive or repair expense twice.
On a narrow screen, scroll the table sideways to compare all three expense budgets.
| Collected occupancy | Entered expenses | Expenses +10% | Expenses +20% |
|---|---|---|---|
| 95% | $1,275Cash remaining | $225Cash remaining | -$825Cash deficit |
| 90% | -$450Cash deficit | -$1,500Cash deficit | -$2,550Cash deficit |
| 85% | -$2,175Cash deficit | -$3,225Cash deficit | -$4,275Cash deficit |
Occupancy here is the collected share of scheduled rent before incentives, not a count of occupied doors. At the entered costs, break-even collected occupancy is 91.3%. Debt-service coverage is 1.16× NOI / debt service; it excludes reserve contributions.
Reference recurring cash is $1,620. Removing half a free month would add $1,440 only if the lease and collections support it. That would still leave just $60 after the assumed $3,000 fee, before other initial cash uses. Do not rely on incentive removal to fund a fee already contracted.
Use the full property cash-flow calculator for the purchase price, financing terms and holding period. Review its expense and reserve conventions before transferring assumptions; this illustration does not automatically populate a deal.
Massachusetts rent questions
Is this a Massachusetts one-bedroom average?
No. The benchmark combines all-home, all-bedroom ZIP indices with equal weight per included ZIP. Use bedroom-specific references and matched leases for a particular apartment; a listing-site one-bedroom average measures a different sample.
Does Cambridge’s survey describe every Boston apartment?
No. Cambridge is a separate submarket in the cited publisher’s Greater Boston apartment study. Postal-city ZIP comparisons, small buildings and other Massachusetts regions have different boundaries and inventories.
Are all renter-paid broker fees prohibited?
The current statute ties payment to the party who originally engaged and contracted with the licensed broker or salesperson. A tenant can engage their own broker. Review the actual engagement rather than assuming every fee has the same payer.
Does the worksheet include the one-time broker fee?
The recurring worksheet excludes the illustrative one-time fee. The decision figure subtracts it separately to expose the first-lease cash need. Actual repeat turnover costs need an explicit budget across the intended holding period.
How these rent figures are calculated
State: Massachusetts · USPS MA · Census state FIPS 25. Zillow supplies postal ZIP observations with city and county labels. We filter to valid positive rents in this state and the latest common observation month, sort the values, and take the middle value, or the mean of the two middle values for an even count. Means are the sum divided by included ZIPs. No population, household or rental-unit weighting is added.
The all-home, all-bedroom ZIP series is smoothed, not seasonally adjusted. A bedroom rent cannot be inferred from it. Membership can change after a refresh, so a change in this page’s median is not a matched-sample rent-growth rate. This edition does not publish a ZIP-sample growth claim.
Data: Zillow Research · ZORI method · National ZIP source CSV. The state benchmark is our ZIP-based calculation, not a provider-published statewide estimate. Occupied-unit Census rent, listing medians, effective broker rents and HUD gross-rent references answer different questions and are not blended here.
The observation month identifies the rent data available for this comparison. Historical or missing latest observations stay out of the current sample. Check the date before comparing a property with a newly advertised offer.
Market and legal sources below were reviewed 2026-10-24. Their own periods are shown next to each claim. Broker samples and boundaries are not fully disclosed; surveys may share underlying providers and should not be treated as independent experiments. The market interpretation is conditional research, not a property-level income guarantee. Recheck local rules, signed comparable leases and actual expenses before using an illustration in a transaction.
Read the source reports
- Colliers Greater Boston Multifamily Report Q3 2026 — Published October 22, 2026; Q3 2026 publisher-defined multifamily market and Cambridge submarket; public report summary accessed October 24, 2026; not a small-building matched sample.
- Worcester information for property owners — Current municipal rental-registry guidance reviewed October 24, 2026; City of Worcester only.
- Massachusetts General Laws c.112 §87DDD½ — Current statutory text effective August 1, 2025, as amended by 2025 c.9 §43; reviewed October 24, 2026.