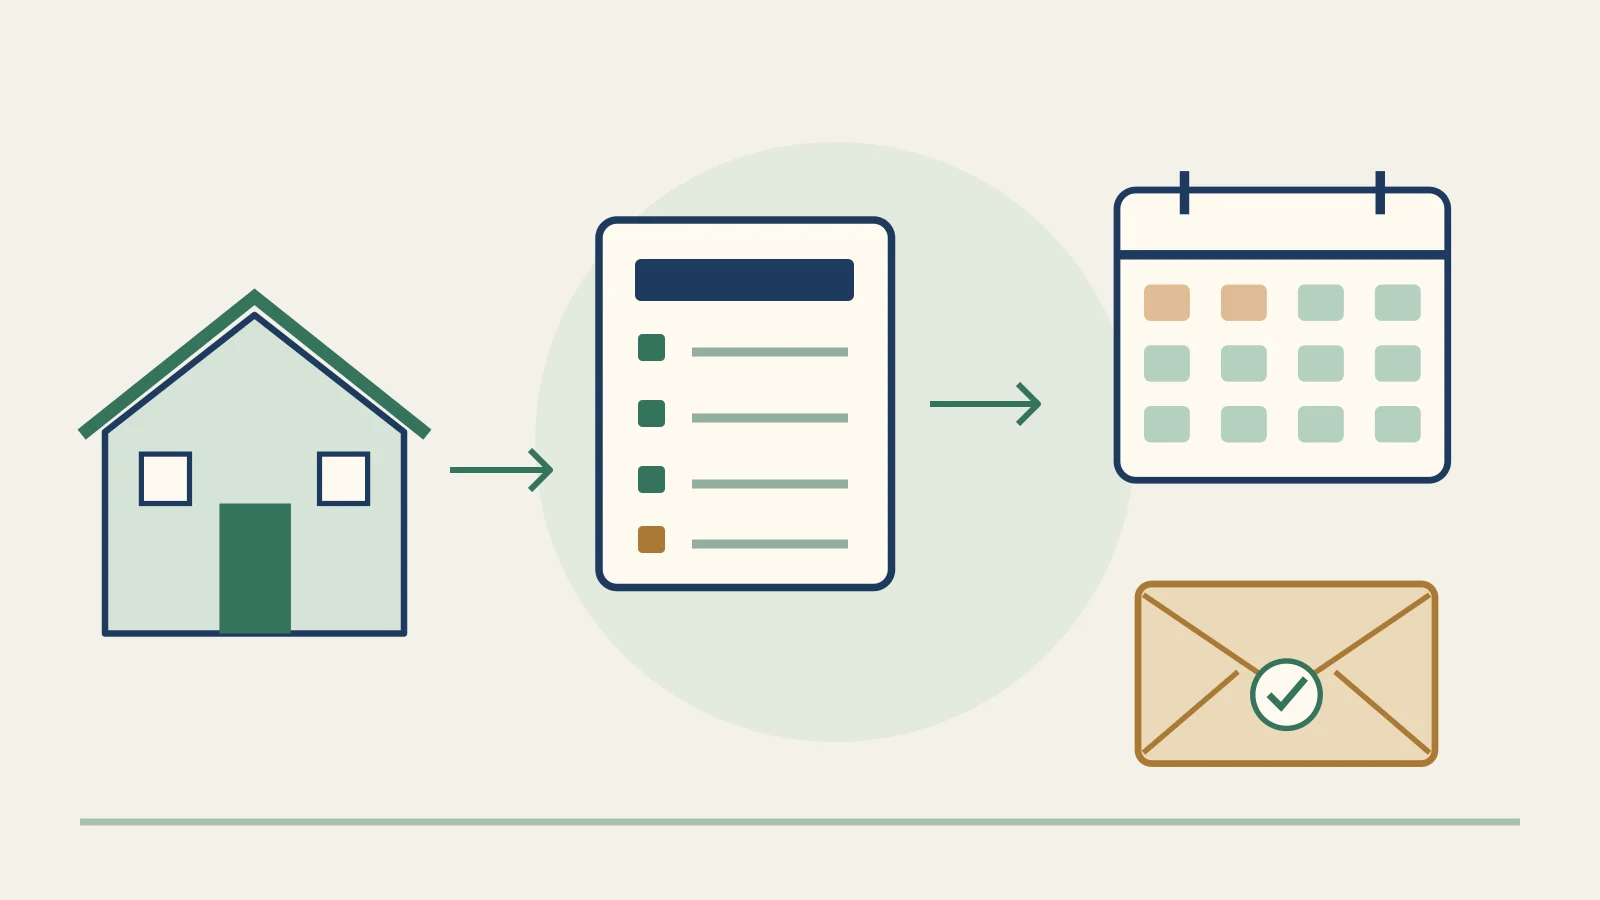
Cash-on-cash return divides a rental's annual pre-tax cash flow by the cash you committed to it. In the hypothetical purchase below, $68,000 committed produces about $3,597 a year after debt and capital reserves: a 5.3% cash-on-cash return.
That percentage measures cash yield. It does not include appreciation, principal paid down, sale proceeds or an assumed tax benefit. More importantly, it is only comparable with another return if both calculations count the same kinds of costs.
The formula
Cash-on-cash return = annual pre-tax cash flow ÷ cash invested × 100
JLL's real-estate glossary defines the metric around cash flow received and cash equity invested. For acquisition screening, this guide uses a conservative planning convention: deduct a capital reserve from annual cash flow and include initial cash earmarked for the property in the denominator. A report of actual distributions may use a different convention. Label it before comparing.
What counts as cash invested
Count the down payment, buyer closing costs, initial work and dedicated opening reserves. If the property needs money before it can earn rent, omitting that money overstates the return.
Here the $68,000 consists of $50,000 down, $6,000 closing costs, $8,000 make-ready work and $4,000 opening reserves. These are hypothetical amounts, not a closing-cost benchmark or lender reserve requirement.
The opening reserve remains your cash. Including it measures the yield on capital you have set aside for this deal and cannot simultaneously use elsewhere. If you choose a denominator excluding idle reserves, show that choice explicitly. Do not quietly compare it with a fully funded denominator.
Borrowed money is not owner equity, but its financing costs still count. If a HELOC funds part of the down payment, include its debt payments in the cash budget and identify the additional borrowing. A smaller equity denominator does not make those obligations disappear.
How it works · illustrated
The denominator records the capital committed to the deal. The numerator measures the annual cash left under a stated budget. The opening reserve is part of the first question; it is not another annual expense.
- Capital committed at acquisition
- $68,000
$50,000 down + $6,000 closing + $8,000 make-ready + $4,000 opening cash.
- Annual cash after reserve and debt
- $3,597
The base budget already deducts the ongoing $1,500 capital allowance.
- Annual cash yield
- 5.3%
Rounded pre-tax planning return. Appreciation, principal paydown and sale proceeds are separate.
Conceptual artwork, not a monetary scale. Original hypothetical acquisition and stabilized annual budget; this is not an actual deal or a promised distribution.
Reviewed October 15, 2026 · Definition: JLL real-estate glossary. Allocation and arithmetic: RentalCalcs.
A reserve allowance is not a bank transfer or an actual bill
The $4,000 opening buffer is capital held for the property. The $1,500 annual capital allowance reduces this guide's estimate of cash available to distribute. Moving money between your own operating and reserve accounts does not create another property cost.
An actual-results report may instead subtract capital work when it is paid. For example, Stessa's own calculation documentation includes capital expenses in net cash flow and excludes transfers. That is a different presentation from a budget that earmarks a recurring allowance. Reconcile the period, transactions and reserve treatment before comparing the percentages.
If the base property's $1,500 allowance funds a $1,500 replacement, do not subtract that same replacement again from the already reserve-adjusted planning cash flow. An actual-spending report would start before that allowance and deduct the bill. Additional spending beyond the allowance changes the result; a transfer alone does not.
What counts as annual pre-tax cash flow
Start with effective income after vacancy and collection loss. Subtract routine operating expenses, the chosen capital allowance, and full principal-and-interest payments. Principal paydown builds equity but still consumes current cash, so interest alone is not the correct debt deduction for an amortizing loan.
The CFPB mortgage-payment explanation distinguishes the principal and interest portions. If taxes and insurance are paid through escrow, do not count them both in operating costs and again inside the debt-payment input.
This guide uses NOI before capital reserves, then deducts the reserve and debt. RentalCalcs' single-family calculator already includes its capital reserve within displayed operating expenses and NOI. Its cash-flow result has therefore already funded that reserve. Do not deduct it a second time.
Income tax belongs in a separate after-tax analysis. Depreciation is not spendable rent, and a projected deduction does not establish that a particular owner can use a loss currently.
Worked example
Assume a $200,000 rental with $2,200 monthly rent, no other income, 25% down and a $150,000 loan at an illustrative 7% over 30 years. A 5% loss allowance covers vacancy and collection loss. Management costs 10% of effective income.
| Annual budget stage | Dollars |
|---|---|
| Scheduled rent | $26,400 |
| Effective income after 5% loss | $25,080 |
| NOI after $8,008 operating costs | $17,072 |
| Income after $1,500 capital reserve | $15,572 |
| Cash after $11,975 debt service | $3,597 |
The operating costs are taxes of $2,400, insurance of $1,300, management of $2,508, routine repairs of $1,500 and other costs of $300. There are no owner-paid utilities or HOA charges in this example. The loan payment is about $998 monthly; calculations use its full precision.
For a matching cash-invested total in the single-family calculator, separate its automatic tax and insurance prepaids from other closing fees. It estimates three months of those bills: $925 here. The example's remaining closing-cost allowance is therefore $5,075, bringing fees and prepaids together to $6,000. Entering $6,000 plus the prepaids would fund a different cash budget.
Cash-on-cash return = $3,597 ÷ $68,000 = 5.3% (rounded)
That is about $300 monthly available after the reserve, not a promise of equal monthly distributions. Rent gaps and repair bills do not arrive in smooth annual fractions.
Now omit the $8,000 make-ready work and $4,000 opening reserves from cash invested, and omit management and the ongoing capital reserve from expenses. The displayed return jumps to 13.6%. Nothing about the house improved. The calculation simply left out cash needs and priced your management work at zero.
Try the worked example
How much cash does $68,000 produce?
Hypothetical annual budget, reviewed October 3, 2026. Change four assumptions. This illustration is available without an account; it does not save a deal.
Annual cash after reserve and debt
$3,597
5.3% of $68,000 committed
NOI before capital reserve
$17,072
$15,572 after the $1,500 reserve.
Original RentalCalcs calculation from the inputs above. Bar lengths show dollar magnitude; a red bar is a deficit. Exact categories appear in the table below.
See all 9 budget lines
| Budget line | Annual dollars |
|---|---|
| Scheduled rent | $26,400 |
| Vacancy and collection loss | -$1,320 |
| Effective income | $25,080 |
| Operating expenses (no capital reserve) | -$8,008 |
| NOI before capital reserve | $17,072 |
| Capital reserve | -$1,500 |
| Income after capital reserve | $15,572 |
| Principal and interest | -$11,975 |
| Cash available after reserve and debt | $3,597 |
Fixed assumptions: $200,000 purchase; $150,000 loan at an illustrative 7% for 30 years; management 10% of effective income; repairs $1,500; other operating costs $300; capital reserve $1,500; initial cash $68,000. No other income, growth, income tax or sale proceeds. Debt uses the full amortizing payment; displayed dollars are rounded.
Download the budget and evidence worksheet (CSV)Match the calculator's inputs, not just its headline percentage
Use itemized expenses and a total 5% vacancy/credit-loss assumption. To reproduce this deliberately simple example, separate additional credit loss and turnover fees are zero, and the $8,000 make-ready budget includes all acquisition work with no extra contingency added. Those zero entries are scenario assumptions, not a recommendation to ignore real costs.
Set opening reserves to $4,000 in total, with no duplicate emergency or repair-fund entry. The ongoing $1,500 capital allowance is separate. In the full calculation, cash required is $68,000, displayed NOI after the capital allowance is $15,572, and annual pre-tax cash is about $3,597. If a result differs, reconcile the lines before changing rent to force a match.
How financing changes the number
Keep rent and costs unchanged and compare three hypothetical purchase structures. For the cash purchase, assume $4,000 closing costs because there are no lender fees; make-ready and opening reserves stay the same. These rates are scenarios, not available loan offers.
| Financing | Initial cash | Annual cash after reserve | Cash-on-cash |
|---|---|---|---|
| All cash | $216,000 | $15,572 | 7.2% |
| 25% down, 7%, 30 years | $68,000 | $3,597 | 5.3% |
| 25% down, 6%, 30 years | $68,000 | $4,780 | 7.0% |
Scroll the table sideways for more columns.
In this example, borrowing at 7% produces a lower percentage cash yield than buying outright. The mortgage requires about $11,975 annually, including principal repayment. Its annual loan constant is about 8.0% of the $150,000 balance; that is different from the 7% interest rate.
The 6% scenario improves cash yield while leaving less cash committed than the outright purchase. It also retains a fixed monthly obligation. Which structure suits the buyer depends on available cash, alternative uses of it and the ability to fund an interruption in rent. The percentage alone does not choose the loan.
For a refinance, state whether you are measuring the original acquisition cash or unrecovered cash after the transaction. Show closing costs, net proceeds and the new debt payment. When remaining cash is zero or negative, an ordinary cash-on-cash percentage is undefined or misleading; report dollars and the full sequence of cash movements instead. The BRRRR cash-left-in guide covers that separate question.
Cash-on-cash vs cap rate, ROI and IRR
Use a second metric only when it answers a question the first cannot.
Cap rate compares property operating income with price before financing. With the conventional NOI used here, $17,072 divided by $200,000 is 8.5%. A version using income after reserves would be 7.8%. Neither is the 5.3% yield on the buyer's $68,000. Keep the reserve convention consistent when comparing listings.
ROI needs a definition of gain and period. A figure adding appreciation or principal paydown can describe wealth changes, but those items are not current spendable cash. Do not compare it directly with cash-on-cash as if the numerator were the same.
IRR considers the timing of cash invested and received, including an exit. It helps compare different holding periods but can be dominated by an optimistic sale assumption. Use the IRR guide when the question involves the whole hold rather than next year's cash.
What is a reasonable target
There is no universal percentage that turns a rental into a good purchase. Set a target in dollars first: the cash you need after funding the property, compared with the money tied up, work involved and alternatives available to you. Then test whether the assumptions support that target.
If this buyer required an illustrative 8% on $68,000, the property would need $5,440 of annual cash. The base case is about $1,843 short, or roughly $154 a month. That is the gap a lower price, lower cost or demonstrably higher rent must close. It is not permission to delete an expense until the answer reads 8%.
The $154 monthly cash gap is not the required gross rent increase. With the same 5% loss allowance and management at 10% of collections, each extra rent dollar leaves $0.855 before unchanged costs. Closing the gap needs about $180 more scheduled rent per month, or roughly $2,380 total.
Confirm that rent with relevant evidence; the calculation does not establish what tenants will pay. The rent-pricing guide helps assess that separate decision.
The 50% expense-rule guide offers a quick screen. Once bills and condition evidence are available, an itemized budget should replace it.
The blind spots
The downside in the widget cuts rent 5% to $2,090, raises vacancy and collection loss to 8%, and increases annual taxes and insurance by $1,500 combined. Annual cash falls from $3,597 to about $291, reducing cash-on-cash return from 5.3% to 0.4%. The mortgage and original cash commitment are unchanged.
A replacement due immediately can be more demanding than that annual ratio suggests. If an $8,000 project is required and only $4,000 sits in the opening reserve, the owner needs another $4,000 before considering other obligations. Do not count a future annual reserve contribution as cash already available. Maintain the component and timing worksheet alongside the return calculation.
A stabilized yield is not the first year's funding schedule
The 5.3% base is a stabilized annual budget. Now assume the first two months after acquisition collect no rent and the next ten collect $2,200 each. This replaces the 5% annual loss allowance; it does not add two vacant months on top of it. Keep the original $68,000 acquisition funding and the same fixed costs. Management remains 10% of collected rent.
The first 12 months · Hypothetical funding schedule
Two empty months reduce the uncommitted $4,000 buffer to $837. Ten collected rent months then rebuild it to $4,825, assuming no owner withdrawals.
- Lowest uncommitted buffer · month 2
- $837
- Net annual cash added
- $825
- Annual cash-on-cash on $68,000
- 1.2%
The line shows buffer dollars after monthly bills and earmarked allowances, not profit accumulated from zero or the total bank balance. The $4,000 starting cash is already in the $68,000 denominator.
Original RentalCalcs calculation · Reviewed October 15, 2026. Same $2,200 rent, loan and fixed costs as the base example. Actual empty months replace the 5% loss allowance; management is 10% of collected rent. Taxes, insurance and repairs are spread monthly; $125 a month is earmarked for capital work. No added leasing fee, owner distributions, additional bill, growth, tax or sale proceeds. Full arithmetic and checkpoints follow.
Open the cash-return and funding worksheetThis is a monthly funding illustration, not an actual bank forecast. Taxes, insurance and routine repairs are spread evenly; $125 a month is earmarked for capital work. The $925 of acquisition prepaids and other earmarked amounts are not counted as uncommitted cash.
A real payment calendar can put bills earlier, so replace these monthly allowances with actual due dates before sizing the buffer. No owner withdrawals or additional leasing fee are modeled.
| Funding checkpoint | Cash change in that period | Uncommitted buffer |
|---|---|---|
| After funding acquisition work and costs | $4,000 opening buffer | $4,000 |
| End of month 1, no rent | -$1,581 | $2,419 |
| End of month 2, no rent | -$1,581 | $837 |
| Each occupied month 3-12 | +$399 per month | Builds to $4,825 at month 12 |
The fixed monthly funding requirement is $5,500 / 12 in taxes, insurance, routine repairs and other costs, plus about $998 principal and interest and $125 capital allowance: $1,581 before management. A collected rent month supplies $2,200 less $220 management, leaving about $399. Full-precision arithmetic gives approximately $825 for the year, or 1.2% on $68,000. Rounded monthly figures will not sum exactly to the rounded annual result.
The $4,825 ending buffer includes the original $4,000; it is not $4,825 of new profit. The annual result also does not guarantee enough cash for an earlier repair. Keep the existing immediate-replacement test separate from this no-extra-bill timeline.
When reviewing actual performance, label the dates. A trailing 12-month result, a first year with lease-up and next year's stabilized forecast answer different questions. Multiplying one unusually good month by 12 does not turn it into a representative year. Later owner contributions, returned capital and refinancing need a dated cash record; do not change the denominator midway without explaining the convention.
Common mistakes
The most consequential errors are mismatched definitions: annual cash divided by only the down payment; a gross-rent forecast with no loss allowance; a payment showing only interest; or a second reserve deduction applied to a result that already includes one.
In the single-family calculator, enter the acquisition cash and itemized expenses, inspect the cash-flow result, and test the uncertain costs. Use the cash-return and funding worksheet to record the period, committed cash, reserve convention, actual bill dates and lowest buffer.
The existing CSV worksheet and interactive scenario remain available. Both are open without an account. Analyses and sensitivity are free; saving requires an account, and paid workflow features are described in pricing.
Reviewed October 15, 2026 by RentalCalcs. The October 3 budget, financing comparisons and downside scenario are retained. This enrichment adds a funding timeline, reserve reconciliation and a rent-gap calculation. Sources and actual calculator behavior were rechecked; all property figures remain hypothetical.
Get new articles and market updates
Investing guides and market data, straight to your inbox. Unsubscribe anytime.
