

New Jersey cap evidence: what can actually be compared
A capitalization rate is annual net operating income divided by property price, before debt. A published cap metric helps select comparables; it cannot establish the subject property’s income or condition.
Dated evidence, not a statewide average
Original display. The numeric scale starts at zero and ends at 10%. Historical, asking and transaction observations retain their labels; missing data is not zero.
| Geography / asset | Period | Reported cap | Basis and limits |
|---|---|---|---|
| Newark and Hudson County scope | 2025; historical context | 5.7% | Matthews / CoStar published cap metric. Sample, weighting and NOI not disclosed. Not all Northern NJ. |
| Northern New Jersey | Q1 2026 | Excluded: conflicting source | Narrative 6.1%; summary panel 6.86%. Sales totals also conflict. No reliable change calculation against 2025. |
| Metro526, Dunellen | Listing accessed October 18, 2026 | 5.76% asking | One marketed 40-unit property. Not a closing, appraisal or independent confirmation of the historical rate. |
The two numeric rows answer different questions and are not a market range. The historical series frames the capital-market discussion; the listing shows a seller’s current offered yield. No numeric northern-versus-coastal premium can be established from this evidence.
One percentage point = 100 basis points. Multiple publishers sharing a dataset do not create independent confirmation. Asking caps, reported-sale medians, averages and modeled county indexes must remain distinct.
The local decisions behind the cap rate
Hudson County: lease-up risk can coexist with a strong commute location
Observed evidence and boundary. IRR’s August midyear commentary identifies new Jersey City and Hoboken luxury deliveries as a source of elevated Class A vacancy. It describes continuing concessions alongside a thinning future pipeline.
A transit advantage may sustain long-term demand without protecting a newly delivered building from free-rent competition next door. For a stabilized acquisition, separate renewals from first-generation leases. For lease-up, show both the cash burn and the rent level that remains after incentives expire.
Direction. RentalCalcs interpretation: stabilization is more defensible than automatic compression until competitive lease-up is visible in collected rents. A smaller future pipeline does not remove apartments already available.
What would change the view. Repeated concession-free renewals, faster absorption and similar stabilized closings at tighter caps would strengthen the compression case. A new wave of lease incentives would weaken it.
Before underwriting. Build a nearby-competitor schedule with effective rents, amenity fees and parking. Check the municipal rent ordinance and any documented exemption before assuming turnover rents are unrestricted.
Evidence: Integra Realty Resources · NJ Department of Community Affairs. Retrieved October 18, 2026. Interpretations and property decisions are RentalCalcs analysis.
Newark and older North Jersey stock: legal rent is an input
Observed evidence and boundary. Matthews’ 2025 Newark/Hudson scope reports 3.0% vacancy and 6.2% annual rent growth. Those are dated regional observations; its Q1 2026 broad-market cap figure is unresolved.
A property’s upside cannot be inferred from a regional asking-rent gain. Newark, Jersey City and neighboring municipalities need separate ordinance checks. A seller’s projected renovation premium should be tested against lawful increases, vacancy treatment, exemptions and actual tenant turnover.
Direction. Editorial interpretation: a documented, collectible rent roll may support stable pricing even when luxury supply is competitive. Do not price a regulatory or renovation assumption as existing NOI.
What would change the view. Verified exempt status and signed leases could substantiate some upside. Missing rent-registration records, unresolved violations or slower turnover can invalidate the improvement schedule.
Before underwriting. Request current and historical legal rents, leases, municipal registration, inspection history and repair bids. Underwrite the in-place case first, then a separately timed improvement case.
Evidence: Matthews · Matthews · NJ Department of Community Affairs. Retrieved October 18, 2026. Interpretations and property decisions are RentalCalcs analysis.
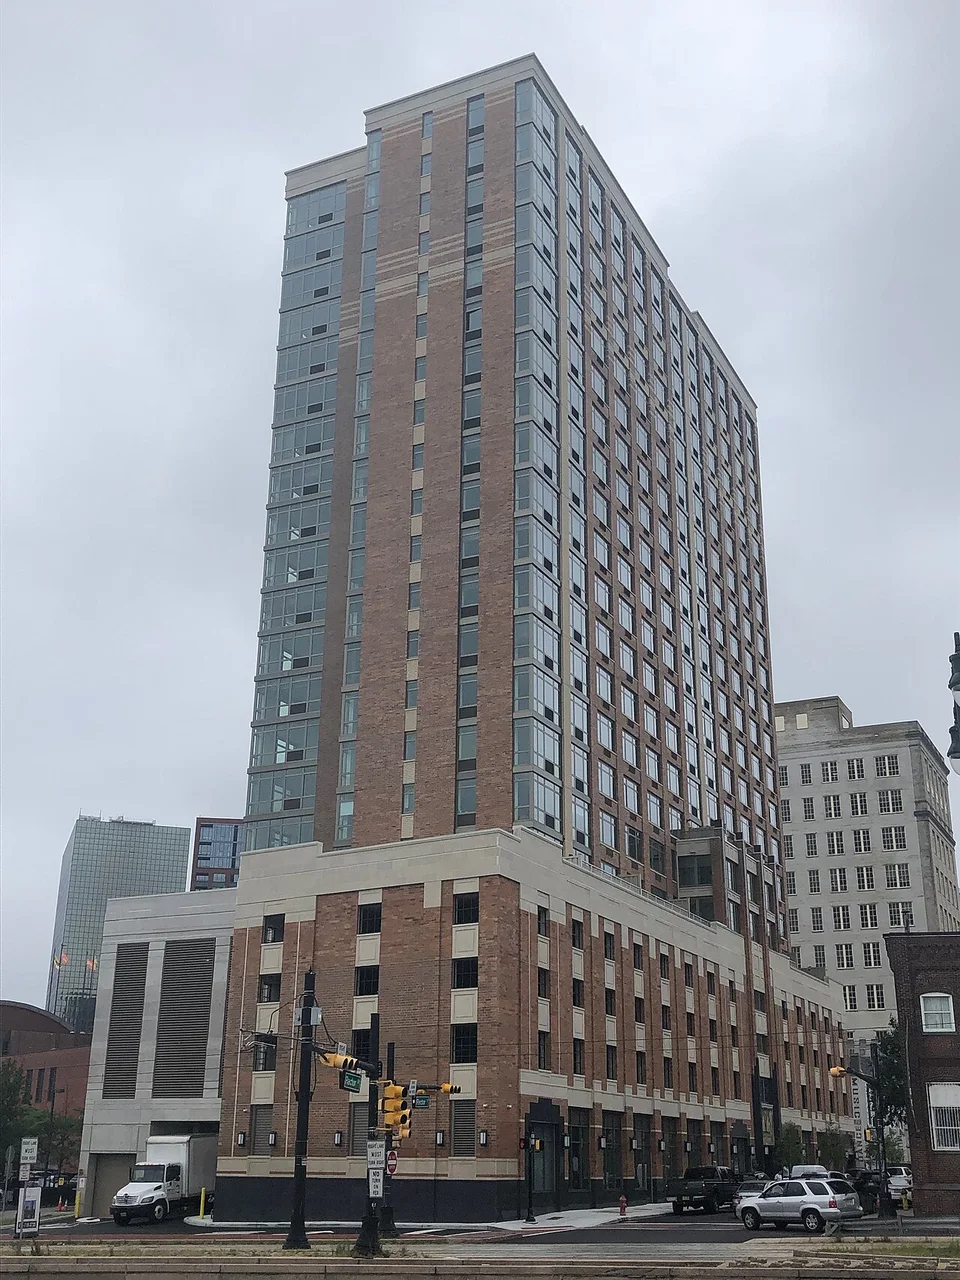

Dunellen and Central Jersey: a listing is a diligence invitation
Observed evidence and boundary. Marcus & Millichap markets Metro526 in Dunellen at $19.25 million, 40 units and a 5.76% offered cap. Occupancy is advertised as 100%. No closed-sale NOI is supplied in the public listing.
A fully leased rent roll can still contain concessions, unpaid balances or expenses that will change on acquisition. The listing’s proximity-to-transit thesis should be tested against comparable commute options and the building’s actual tenant retention, not treated as a cap-rate adjustment.
Direction. Editorial interpretation: this property shows current seller expectations, not a Central Jersey clearing yield. A local closing with verified trailing expenses would carry more evidentiary weight.
What would change the view. A completed transaction at the offered terms with disclosed buyer NOI would make the evidence stronger. Changes to price, occupancy or the offered NOI would make the snapshot stale.
Before underwriting. Rebuild the advertised NOI using buyer taxes, insurance, management and reserves; reconcile the resulting cap with the offering. Obtain several closed Central Jersey comparables before an offer.
Evidence: Marcus & Millichap · NJ Division of Taxation. Retrieved October 18, 2026. Interpretations and property decisions are RentalCalcs analysis.
Monmouth and Ocean: employment upside must arrive after competing supply
Observed evidence and boundary. IRR’s coastal midyear commentary identifies active leasing at Presidential Gardens in Manchester and the Livana projects in Long Branch and Colts Neck; it expects housing demand from the Fort Monmouth Netflix development.
The timing matters more than the headline investment. A buyer can face competing apartments now while employer-related demand arrives later. Annual apartment leases, seasonal accommodation and student or temporary-worker rentals are separate revenue models.
Direction. Editorial interpretation: treat the employment story as an upside scenario until tenant demand and lease terms substantiate it. Do not import a Hudson County cap into Monmouth or Ocean.
What would change the view. Faster job occupancy and verified lease absorption could strengthen income. Delivery delays, persistent incentives or higher insurance deductibles would reduce the benefit.
Before underwriting. Obtain the exact delivery calendar, actual leasing incentives and year-round rent comparisons. Quote flood, wind, business-income and ordinance coverage for the parcel before finalizing NOI.
Evidence: Integra Realty Resources · NJ DOBI. Retrieved October 18, 2026. Interpretations and property decisions are RentalCalcs analysis.
Secondary markets and missing evidence
| Market | Coverage | Remaining gap |
|---|---|---|
| Hudson / Newark | Historical cap metric, current operating commentary and explicit source conflict | No reliable current comparable cap series or neighborhood cap grid. |
| Central Jersey and coast | One current asking cap; named coastal supply and appraisal commentary | No current closed-sale cap sample by municipality. |
| South Jersey / Camden / Atlantic / rural markets | No quantitative rate assigned | Philadelphia metro evidence is not South Jersey-only. Obtain municipal closed sales and separate seasonal from annual leases. |
No neighborhood cap is assigned without matching neighborhood evidence. Missing evidence is a reason to obtain more comparables, not to add an arbitrary geographic spread.
Three cap-rate paths, and the evidence each needs
Matthews’ earlier North Jersey outlook emphasizes renter demand; IRR’s midyear view highlights luxury supply and concessions. The geography and time differ, so the change in tone is not proof either source was wrong.
IRR provides an appraisal perspective; Matthews uses CoStar research. Their commentary is useful comparison, not independent validation of an unresolved cap number. Related IRR northern and coastal reports remain one publisher family.
RentalCalcs base case: selective stabilization. Current collected income, legal rent growth and buyer costs should carry the acquisition. Neither anticipated policy-rate cuts nor an advertised yield establishes cheaper property borrowing costs.
Compression
Hudson lease-up clears and suburban income attracts more funded buyers.
Watch: Effective renewals, concession expiration, comparable closings and lender spreads.
Invalidated or weakened by: Apparent improvement is only asking rent, favorable exemptions are unverified, or new supply keeps incentives high.
Underwriting consequence: Pay for documented income; keep cap compression as upside.
Stabilization
Demand absorbs available units while financing and buyer expenses limit multiple expansion.
Watch: Local rent-roll collections, quote-backed expenses and time to close.
Invalidated or weakened by: A broad set of matched closings establishes a different pricing level, or actual income declines.
Underwriting consequence: Use a flat exit cap and a lawful rent-growth schedule.
Expansion
Luxury competition, insurance costs or restricted rent increases erode buyer NOI; debt remains costly.
Watch: Free-rent renewals, repair obligations, local ordinance changes and loan proceeds.
Invalidated or weakened by: Concession-free collections and completed comparable trades persist at stronger prices.
Underwriting consequence: Reduce offer or leverage; stress a wider exit cap and seller transaction costs.
These are conditional RentalCalcs scenarios, not publisher probability forecasts or basis-point targets. Policy rates, Treasury yields, lender spreads and the borrowing constant are different inputs. No policy-rate cut is assumed to pass through automatically to property debt.
What a wider cap does to your property value
Value = annual NOI ÷ (cap rate ÷ 100). At constant income, a higher cap reduces value. A move from 5% to 6% is +100 bps and a 16.7% value decline, not a 1% decline.
From this market evidence to an offer
- Establish lawful incomeAudit leases, local rent rules, concessions and registration before using a market-rent upside.
- Replace seller costsCheck municipal taxes or PILOT terms and quote property-specific coverage.
- Carry the exit frictionModel the applicable seller fees, debt payoff and sale costs separately from gross cap value.
Hypothetical assumptions. NOI change is cumulative over your chosen holding period, not an annual growth rate. Results exclude debt, sale costs, taxes and interim cash flow.
Starting value $2,400,000
Exit value $2,310,000 (-3.7%)
$168,000 starting NOI at 7% → $184,800 exit NOI at 8%. NOI must change by 14.3% to preserve starting value at this exit cap rate.
Fixed reference matrix: your income has to offset the multiple
| Total NOI change | 6.50% exit | 7.00% exit | 7.50% exit | 8.00% exit |
|---|---|---|---|---|
| -10% total NOI | -3.1% | -10.0% | -16.0% | -21.2% |
| 0% total NOI | +7.7% | 0.0% | -6.7% | -12.5% |
| +10% total NOI | +18.5% | +10.0% | +2.7% | -3.7% |
| +20% total NOI | +29.2% | +20.0% | +12.0% | +5.0% |
This fixed matrix does not change when you edit the interactive tool. No selling costs, tax, debt payoff or interim cash flows are included. Total NOI growth is cumulative, not annual. Use a full cash-flow model for an investment return.
A buyer budget that reconciles before the debt
Hypothetical 12-unit acquisition at $2,400,000, with $2,200 scheduled monthly rent per unit. These assumptions illustrate a process; they are not market rents, quoted insurance or a forecast for any property.
Replace the $52,000 tax allowance with municipal/PILOT evidence. Test concession burn-off and lawful increases before adding rent upside; model NJ seller fees separately at exit.
| Budget line | Annual amount |
|---|---|
| Scheduled apartment rent | $316,800 |
| Other recurring income | $4,800 |
| Vacancy / concessions / collection loss | −$16,000 |
| Effective gross income | $305,600 |
| Buyer property taxes | −$52,000 |
| Insurance allowance | −$18,000 |
| Owner-paid utilities | −$17,000 |
| Recurring maintenance | −$21,000 |
| Management | −$20,000 |
| Administration / licenses / other recurring | −$9,600 |
| NOI before financing and reserves | $168,000 |
Going-in cap: 7.00%. Immediate work of $120,000 is capital spending outside NOI; recurring repairs are already included above. An annual $7,200 replacement reserve is deducted below NOI in this example.
| Measure | Result / assumption |
|---|---|
| Loan / interest / amortization | $1,440,000 / 6.5% assumed / 30 years; monthly amortizing payments, no interest-only period |
| Annual principal and interest | $109,221 |
| Replacement reserve outside NOI | $7,200 |
| Cash flow after debt and reserves | $51,579 |
| Down payment + closing + initial work | $960,000 + $72,000 + $120,000 = $1,152,000 |
| Cash-on-cash, before income tax | 4.48% = cash flow ÷ total invested cash |
| DSCR, before / after replacement reserve | 1.54× / 1.47× |
| Debt yield, before / after replacement reserve | 11.67% / 11.17% |
The interest assumption is not a current loan quote. DSCR = the stated NOI numerator ÷ annual debt service; debt yield = the stated numerator ÷ loan principal. Lenders may deduct reserves or make other adjustments. Closing and initial work are funded from cash; no extra initial reserve deposit is assumed. If a lender requires one, add it to invested cash. Yield on cost requires a separately defined stabilized NOI and total project basis; it is not the going-in cap.
How much room does this buyer actually have? The amortizing loan constant is 7.58%: annual debt service divided by loan principal. Compare that payment burden with the 7.00% going-in cap, rather than comparing the cap only with the interest coupon. In this example, adding leverage reduces current equity cash yield before tax. With debt service and reserves fixed, an annual NOI reduction of $51,579 (30.7%) would consume the remaining cash flow. This is an NOI stress, not the same percentage decline in rent; rebuild income and expenses separately.
Taxes and exit costs
Get the municipal assessment, current rate and any PILOT or abatement agreement; verify transfer treatment. NJ’s Realty Transfer Fee and Graduated Percent Fee guidance must be applied by property class and consideration. Do not assume the former buyer-paid 1% rule is the current closing rule. Budget the seller’s applicable charges in the exit case.
Evidence: NJ Division of Taxation. Retrieved October 18, 2026. Interpretations and property decisions are RentalCalcs analysis.
Local rent rules and registration
DCA supplies landlord-tenant guidance and a rent-control survey. Obtain the actual municipal ordinance and building registration; the survey alone does not establish the parcel’s exemption or permitted increase.
Evidence: NJ Department of Community Affairs. Retrieved October 18, 2026. Interpretations and property decisions are RentalCalcs analysis.
Insurance
DOBI explains that standard homeowners coverage excludes flood damage. An apartment buyer needs a commercial policy review, flood quote where relevant and the actual wind/flood deductibles. The example’s premium is an assumption, not a quote.
Evidence: NJ DOBI. Retrieved October 18, 2026. Interpretations and property decisions are RentalCalcs analysis.

Free worksheet: turn unknowns into document requests
The printable worksheet gives you room to record the source, date and buyer adjustment for every income, expense, capital and exit assumption. It includes this edition’s local checks.
For a full property model, use the multifamily calculator. The single-family calculator supports a separate 1–4-unit workflow. These links do not transfer this page’s inputs; re-enter and verify your assumptions.
Compare local screening context: Hudson County · Essex County. County rent-to-price screens are modeled indexes, not matched closed-sale NOI caps. Explore the New Jersey market directory.
Questions before an offer
Why omit the newer Northern NJ cap figure?
Its narrative and summary disagree. Choosing either would create false precision; the report records the conflict for a future correction.
Does 5.76% prove Central Jersey trades around that rate?
No. It is one Dunellen listing’s offered cap; pricing and stated income have not been verified as a completed transaction.
Can I increase rents to the regional average?
Only if leases, lawful increases, unit condition and actual tenant demand support it. Municipal regulation and building exemptions require individual review.
Source ledger, dates and refresh rules
Research retrieved October 18, 2026. Observations, publisher outlooks and our conditional interpretation are labeled separately. This ledger summarizes publicly available research; it does not redistribute proprietary report datasets. Brokers may be selling services or properties; appraisal commentary is not a guarantee of future pricing.
Matthews
Geography: 2025 Newark and Hudson County scope. Period: 2025. Published: 2026; exact date to verify. Accessed: 2026-10-18.
Property scope: Multifamily / apartments; inventory limits stated in observation. Class: Not disclosed unless specified in observation or sample limits. Substantive review: 2026-10-18.
Provider: CoStar / Matthews. Measure: 5.7% cap; 3.0% vacancy; 6.2% rent growth. Statistic: Publisher-reported observation.
NOI convention: Not disclosed; do not assume trailing or forward NOI. Sample: Not disclosed. Weighting: Not disclosed unless specified in metric.
Limits: Historical, not statewide; statistic convention and sample undisclosed. Refresh: Next source edition, correction, or material change in the cited rule.
Matthews
Geography: Northern New Jersey publisher market. Period: Q1 2026. Published: 2026-05-11. Accessed: 2026-10-18.
Property scope: Multifamily / apartments; inventory limits stated in observation. Class: Not disclosed unless specified in observation or sample limits. Substantive review: 2026-10-18.
Provider: CoStar. Measure: Conflicting cap and sales totals. Statistic: Publisher-reported observation.
NOI convention: Not disclosed; do not assume trailing or forward NOI. Sample: Not disclosed. Weighting: Not disclosed unless specified in metric.
Limits: Excluded from quantitative benchmark: 6.1% narrative versus 6.86% summary. Refresh: Next source edition, correction, or material change in the cited rule.
Integra Realty Resources
Geography: Northern NJ / Hudson County. Period: Midyear 2026. Published: August 2026. Accessed: 2026-10-18.
Property scope: Multifamily / apartments; inventory limits stated in observation. Class: Not disclosed unless specified in observation or sample limits. Substantive review: 2026-10-18.
Provider: IRR local valuation commentary; data lineage undisclosed in summary. Measure: Luxury supply and concessions commentary. Statistic: Publisher-reported observation.
NOI convention: Not disclosed; do not assume trailing or forward NOI. Sample: Not disclosed. Weighting: Not disclosed unless specified in metric.
Limits: Forecast is opinion; underlying survey and transaction samples not disclosed. Refresh: Next source edition, correction, or material change in the cited rule.
Integra Realty Resources
Geography: Coastal NJ / Monmouth / Ocean. Period: Midyear 2026. Published: August 2026. Accessed: 2026-10-18.
Property scope: Multifamily / apartments; inventory limits stated in observation. Class: Not disclosed unless specified in observation or sample limits. Substantive review: 2026-10-18.
Provider: IRR local valuation commentary. Measure: Named development and employer-demand outlook. Statistic: Publisher-reported observation.
NOI convention: Not disclosed; do not assume trailing or forward NOI. Sample: Not disclosed. Weighting: Not disclosed unless specified in metric.
Limits: Project timing and rental asks are not achieved rents or cap observations. Refresh: Next source edition, correction, or material change in the cited rule.
Marcus & Millichap
Geography: Metro526, Dunellen, Middlesex County. Period: Listing snapshot October 18, 2026. Published: Not stated. Accessed: 2026-10-18.
Property scope: Multifamily / apartments; inventory limits stated in observation. Class: Not disclosed unless specified in observation or sample limits. Substantive review: 2026-10-18.
Provider: Seller/broker offering. Measure: 5.76% asking cap; $19.25m; 40 units. Statistic: Asking cap.
NOI convention: Not disclosed; do not assume trailing or forward NOI. Sample: One offered property. Weighting: Not disclosed unless specified in metric.
Limits: Broker marketing context; asking NOI unaudited; may change. Refresh: Next source edition, correction, or material change in the cited rule.
NJ Division of Taxation
Geography: New Jersey transfers; applicability varies. Period: Current guidance accessed October 18, 2026. Published: See dated notices on page. Accessed: 2026-10-18.
Property scope: Property guidance / resource; not a cap observation. Class: Not applicable. Substantive review: 2026-10-18.
Provider: State of NJ. Measure: Realty Transfer / Graduated Percent Fee guidance. Statistic: Official guidance.
NOI convention: Not applicable (not a cap-rate observation). Sample: Not applicable. Weighting: Not applicable.
Limits: Confirm class, exemptions and transaction structure with closing professional. Refresh: Next source edition, correction, or material change in the cited rule.
NJ Department of Community Affairs
Geography: NJ landlord-tenant / local rent regulation. Period: Current guidance accessed October 18, 2026. Published: Not stated. Accessed: 2026-10-18.
Property scope: Property guidance / resource; not a cap observation. Class: Not applicable. Substantive review: 2026-10-18.
Provider: NJ DCA; municipal ordinances remain controlling. Measure: Rent control survey and landlord guidance. Statistic: Official guidance.
NOI convention: Not applicable (not a cap-rate observation). Sample: Not applicable. Weighting: Not applicable.
Limits: No claim that all NJ buildings share one rent cap. Refresh: Next source edition, correction, or material change in the cited rule.
NJ DOBI
Geography: NJ flood insurance guidance. Period: Current guidance accessed October 18, 2026. Published: Not stated. Accessed: 2026-10-18.
Property scope: Property guidance / resource; not a cap observation. Class: Not applicable. Substantive review: 2026-10-18.
Provider: NJ DOBI. Measure: Flood exclusion notice. Statistic: Official guidance.
NOI convention: Not applicable (not a cap-rate observation). Sample: Not applicable. Weighting: Not applicable.
Limits: Homeowners guidance is not a commercial apartment quote. Refresh: Next source edition, correction, or material change in the cited rule.
Refresh the affected figures and interpretation together when a new edition, correction or material operating rule appears. A retrieval or rebuild is not a new observation. Report a correction through RentalCalcs contact, including the source, edition, geography and affected claim.