

Pennsylvania cap evidence: what can actually be compared
A capitalization rate is annual net operating income divided by property price, before debt. A published cap metric helps select comparables; it cannot establish the subject property’s income or condition.
Dated evidence, not a statewide average
Original display. The numeric scale starts at zero and ends at 10%. Historical, asking and transaction observations retain their labels; missing data is not zero.
| Geography / asset | Period | Reported cap | Basis and limits |
|---|---|---|---|
| Philadelphia publisher market | H1 2026 | Mid-5% range | Average on disclosed deals; no precise numeric point supplied. 16 total trades; cap-reporting count unknown. Includes markets outside PA. |
| Pittsburgh publisher market | H1 2026 | ≈7.5% | Published transaction average. Almost all transactions were Class C. Not a stabilized Class A benchmark. |
Do not subtract these rows to estimate a location adjustment. A broader or older building cohort can produce a higher average without any individual property repricing. Philadelphia’s verbal range is deliberately not converted to 5.5% for plotting. Neither series establishes a statewide average.
One percentage point = 100 basis points. Multiple publishers sharing a dataset do not create independent confirmation. Asking caps, reported-sale medians, averages and modeled county indexes must remain distinct.
The local decisions behind the cap rate
Philadelphia: stabilization needs to reach collected income
Observed evidence and boundary. Northmarq reports Q2 urban vacancy of 5.0%; metro vacancy was 4.6% and asking rent $1,902. CBRE separately describes declining downtown concessions and muted investment activity.
For a Center City or University City acquisition, compare the actual concessions on competing leases with the seller’s effective income. A signed lease with free months can raise physical occupancy before it produces a full year of cash rent. The metro’s cross-state boundary also makes a Delaware transaction an imperfect check on Philadelphia taxes and licensing.
Direction. RentalCalcs interpretation: operations can stabilize before cap rates compress. Underwrite a flat-cap acquisition until a comparable stabilized sale and the property’s collection history support paying more per dollar of income.
What would change the view. This view weakens if concessions continue to fall and several similar, fully occupied properties close at tighter caps using the same NOI convention. It also becomes too optimistic if the property needs fresh concessions at renewal.
Before underwriting. Obtain lease abstracts, free-rent expiration dates, monthly collections and the abatement schedule. Model the first full taxable year, not merely the seller’s last tax payment.
Evidence: Northmarq Q2 report, pp. 1, 3–5 · CBRE · City of Philadelphia OPA. Retrieved October 18, 2026. Interpretations and property decisions are RentalCalcs analysis.
Northeast Philadelphia and suburban supply: use the exact boundary
Observed evidence and boundary. Northmarq’s Q2 table flags Northeast Philadelphia vacancy of 7.8% and annual asking-rent decline of 5.0%. Its outlook identifies Far Northeast, Upper Darby–Drexel Hill, King of Prussia and West Chester as locations with limited near-term supply.
“Northeast” and “Far Northeast” are not interchangeable underwriting geographies. A broad submarket average can include competing product outside a building’s true renter catchment. A suburban address also does not insulate a property from projects that will deliver later in the holding period.
Direction. Editorial interpretation: selectivity matters more than a generic urban-versus-suburban allocation. Match commute, bedroom count, parking and price band before applying the regional rent story.
What would change the view. A lease audit showing steady renewals and no concession leakage could support a stronger property than the broad Northeast average. Conversely, permitted nearby projects could weaken a seemingly protected suburb.
Before underwriting. Map competing deliveries by opening date and effective rent. Ask the broker for closed comparables within the same renter catchment; do not assign a neighborhood cap from these operating statistics.
Evidence: Northmarq Q2 report, pp. 1, 3–5 · Northmarq. Retrieved October 18, 2026. Interpretations and property decisions are RentalCalcs analysis.
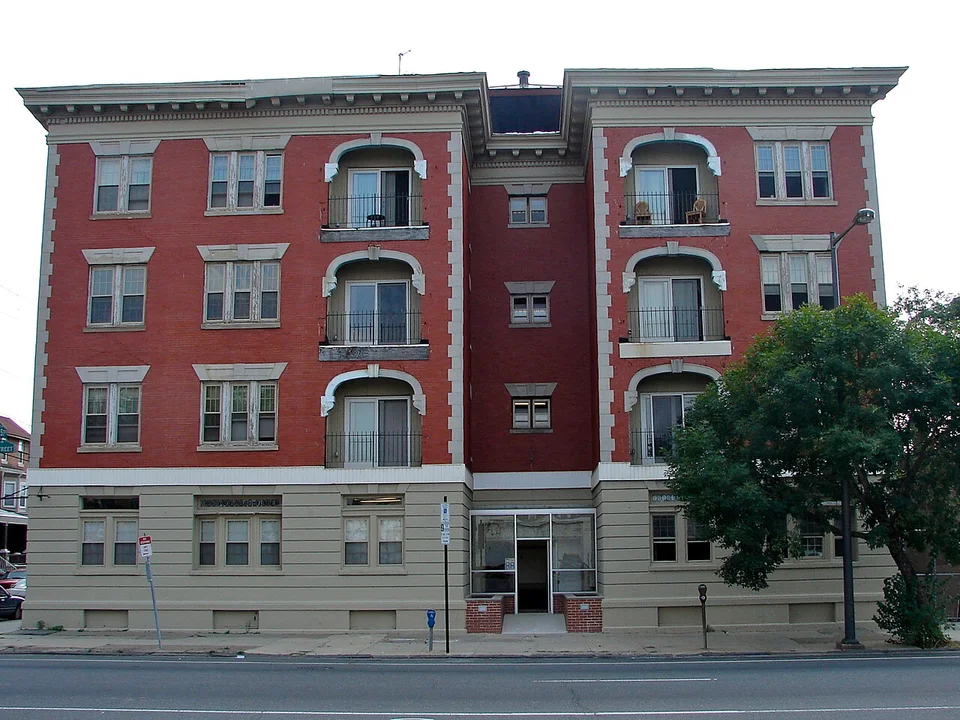

Pittsburgh: workforce performance and capital work belong in the same model
Observed evidence and boundary. Northmarq’s Q2 report gives 4.8% metro vacancy and 3.1% annual asking-rent growth. Class C vacancy was 2.9%. Its sales discussion shows a wide cap distribution around the 7.5% H1 average.
A high going-in yield on an older property is not cash available for distribution if roofs, heat, water service or turnover work require immediate spending. Do not treat stronger Class C occupancy as evidence that a deferred-maintenance purchase has the same risk as a renovated stabilized asset.
Direction. Editorial interpretation: income resilience supports a stable-cap base case for a verified workforce rent roll. Compression should be earned by operations and comparable closings, not assumed because the reported average looks high.
What would change the view. A binding repair bid or insurance exclusion can erase the apparent yield advantage. Stronger rents also do not solve debt coverage if the borrowing constant exceeds the acquisition cap.
Before underwriting. Reconcile a trailing rent roll to bank collections, obtain a system-by-system capital schedule and compare after-reserve debt coverage. Separate repairs in NOI from replacement capital and upfront work.
Evidence: Northmarq Q2 report, pp. 1, 3–5. Retrieved October 18, 2026. Interpretations and property decisions are RentalCalcs analysis.
South Allegheny and the missing higher-price trades
Observed evidence and boundary. Northmarq’s July 21 commentary says South Allegheny supplied nearly 40% of H1 transactions; Downtown Pittsburgh and Beaver County recorded none in that source’s period. More than 90% of the trading properties were Class C.
A lower metro median price can be produced by the absence of expensive neighborhoods. It does not demonstrate that a downtown property’s value declined by the same amount. South Allegheny’s activity improves local price discovery only when the closed buildings match the property being evaluated.
Direction. Editorial interpretation: give actual same-vintage local closings more weight than the metro headline. A future return of institutional sales could lower a reported average cap through composition alone.
What would change the view. A broader matched sample showing the same change across locations would weaken the composition explanation. Continued sparse sales would keep any directional conclusion fragile.
Before underwriting. Request the cap-reporting subset and each comparable’s in-place NOI. For Downtown and Beaver, do not manufacture a current cap from a period with no reported trades.
Evidence: Northmarq. Retrieved October 18, 2026. Interpretations and property decisions are RentalCalcs analysis.
Secondary markets and missing evidence
| Market | Coverage | Remaining gap |
|---|---|---|
| Philadelphia and Pittsburgh | Current metro cap and operating reports; selected submarket operations and sales mix | No comparable neighborhood cap grid; Philadelphia includes non-PA markets. |
| Lehigh Valley; Harrisburg–York–Lancaster; Erie; Scranton–Wilkes-Barre | Qualitative diligence boundary only in this edition | No verified like-for-like current apartment cap cohort. Obtain local closed sales, employer exposure and competing deliveries before using either major-metro reference. |
| Rural and university towns | No quantitative cap assignment | Check seasonal academic leasing, concentration of demand, management depth and exit buyer pool independently. Metro vacancy does not establish a rural turnover budget. |
No neighborhood cap is assigned without matching neighborhood evidence. Missing evidence is a reason to obtain more comparables, not to add an arbitrary geographic spread.
Three cap-rate paths, and the evidence each needs
Northmarq expects gradual Philadelphia transaction recovery as supply risk becomes clearer; its Pittsburgh outlook allows selective compression. These are publisher forecasts, not measured future outcomes. The two reports belong to one research organization and are not independent forecasts.
CBRE’s Philadelphia commentary separates healthy leasing from cautious capital markets. That is a distinct analytical perspective, although commercial datasets may overlap; it does not independently validate Northmarq’s cap average.
RentalCalcs base case: stabilization with property-specific exceptions. The central question is whether improved occupancy survives buyer taxes, concessions and capital work. A better rent print alone does not justify an exit-cap reduction.
Compression
Collected NOI becomes durable while comparable stabilized sales clear with more competitive financing.
Watch: Concession burn-off, renewals after free-rent periods, same-vintage closed caps and actual loan quotes.
Invalidated or weakened by: Lease-up stalls, buyer expenses rise faster than income, or tighter reported caps come only from a change in assets sold.
Underwriting consequence: Treat any tighter exit cap as upside. Confirm returns at the acquisition cap before paying for it.
Stabilization
Income improves but higher borrowing costs and thin sales prevent buyers from paying a higher multiple.
Watch: Effective rent and debt quotes hold steady while the same local product continues to trade.
Invalidated or weakened by: Sustained deterioration in collections or a broad, comparable set of tighter closings.
Underwriting consequence: Keep the exit cap flat and use documented income changes, with a wider-cap downside.
Expansion
Concessions, taxes or repair exposure reduce buyer NOI while debt remains expensive.
Watch: Rent-roll concessions, renewal losses, lender proceeds, property insurance terms and capital bids.
Invalidated or weakened by: Strong collections persist through turnover and comparable buyers accept tighter yields without unsupported rent assumptions.
Underwriting consequence: Lower the offer or leverage; reserve cash for work. Test a full percentage-point wider exit cap.
These are conditional RentalCalcs scenarios, not publisher probability forecasts or basis-point targets. Policy rates, Treasury yields, lender spreads and the borrowing constant are different inputs. No policy-rate cut is assumed to pass through automatically to property debt.
What a wider cap does to your property value
Value = annual NOI ÷ (cap rate ÷ 100). At constant income, a higher cap reduces value. A move from 5% to 6% is +100 bps and a 16.7% value decline, not a 1% decline.
From this market evidence to an offer
- Identify the sampleSeparate the Philadelphia cross-state market from PA-only comparables; check Pittsburgh vintage and submarket mix.
- Rebuild buyer incomeReplace abated seller taxes, concessions and omitted operating costs with documented buyer assumptions.
- Price the cash requirementStress the exit cap, lender coverage and upfront work together before setting an offer.
Hypothetical assumptions. NOI change is cumulative over your chosen holding period, not an annual growth rate. Results exclude debt, sale costs, taxes and interim cash flow.
Starting value $2,000,000
Exit value $1,885,714 (-5.7%)
$120,000 starting NOI at 6% → $132,000 exit NOI at 7%. NOI must change by 16.7% to preserve starting value at this exit cap rate.
Fixed reference matrix: your income has to offset the multiple
| Total NOI change | 5.50% exit | 6.00% exit | 6.50% exit | 7.00% exit |
|---|---|---|---|---|
| -10% total NOI | -1.8% | -10.0% | -16.9% | -22.9% |
| 0% total NOI | +9.1% | 0.0% | -7.7% | -14.3% |
| +10% total NOI | +20.0% | +10.0% | +1.5% | -5.7% |
| +20% total NOI | +30.9% | +20.0% | +10.8% | +2.9% |
This fixed matrix does not change when you edit the interactive tool. No selling costs, tax, debt payoff or interim cash flows are included. Total NOI growth is cumulative, not annual. Use a full cash-flow model for an investment return.
A buyer budget that reconciles before the debt
Hypothetical 12-unit acquisition at $2,000,000, with $1,500 scheduled monthly rent per unit. These assumptions illustrate a process; they are not market rents, quoted insurance or a forecast for any property.
Philadelphia abatement expiry or Pittsburgh capital work: replace the $28,000 tax allowance and $90,000 immediate-work budget with parcel evidence and binding bids.
| Budget line | Annual amount |
|---|---|
| Scheduled apartment rent | $216,000 |
| Other recurring income | $4,000 |
| Vacancy / concessions / collection loss | −$11,000 |
| Effective gross income | $209,000 |
| Buyer property taxes | −$28,000 |
| Insurance allowance | −$12,000 |
| Owner-paid utilities | −$14,000 |
| Recurring maintenance | −$15,000 |
| Management | −$14,000 |
| Administration / licenses / other recurring | −$6,000 |
| NOI before financing and reserves | $120,000 |
Going-in cap: 6.00%. Immediate work of $90,000 is capital spending outside NOI; recurring repairs are already included above. An annual $6,000 replacement reserve is deducted below NOI in this example.
| Measure | Result / assumption |
|---|---|
| Loan / interest / amortization | $1,200,000 / 6.5% assumed / 30 years; monthly amortizing payments, no interest-only period |
| Annual principal and interest | $91,018 |
| Replacement reserve outside NOI | $6,000 |
| Cash flow after debt and reserves | $22,982 |
| Down payment + closing + initial work | $800,000 + $60,000 + $90,000 = $950,000 |
| Cash-on-cash, before income tax | 2.42% = cash flow ÷ total invested cash |
| DSCR, before / after replacement reserve | 1.32× / 1.25× |
| Debt yield, before / after replacement reserve | 10.00% / 9.50% |
The interest assumption is not a current loan quote. DSCR = the stated NOI numerator ÷ annual debt service; debt yield = the stated numerator ÷ loan principal. Lenders may deduct reserves or make other adjustments. Closing and initial work are funded from cash; no extra initial reserve deposit is assumed. If a lender requires one, add it to invested cash. Yield on cost requires a separately defined stabilized NOI and total project basis; it is not the going-in cap.
How much room does this buyer actually have? The amortizing loan constant is 7.58%: annual debt service divided by loan principal. Compare that payment burden with the 6.00% going-in cap, rather than comparing the cap only with the interest coupon. In this example, adding leverage reduces current equity cash yield before tax. With debt service and reserves fixed, an annual NOI reduction of $22,982 (19.2%) would consume the remaining cash flow. This is an NOI stress, not the same percentage decline in rent; rebuild income and expenses separately.
Buyer taxes and abatements
Philadelphia offers several different abatement and exemption programs. Verify the parcel’s approved program, remaining term and taxable land/improvements. A seller’s bill or owner exemption is not a buyer estimate. Outside Philadelphia obtain the municipal, county and school assessment treatment.
Evidence: City of Philadelphia OPA. Retrieved October 18, 2026. Interpretations and property decisions are RentalCalcs analysis.
Rental operations
Philadelphia requires a Rental License. Check the license, tax clearance, open violations and lead documentation before assigning uninterrupted collections. This city source does not establish rules throughout Pennsylvania.
Evidence: City of Philadelphia. Retrieved October 18, 2026. Interpretations and property decisions are RentalCalcs analysis.
Insurance and capital
Obtain a property-specific replacement-cost and liability quote, flood determination and business-income terms. The example premium is a hypothetical budget, not a Pennsylvania market quote. Coordinate each capital item with lost-rent timing.
Evidence: FEMA. Retrieved October 18, 2026. Interpretations and property decisions are RentalCalcs analysis.

Free worksheet: turn unknowns into document requests
The printable worksheet gives you room to record the source, date and buyer adjustment for every income, expense, capital and exit assumption. It includes this edition’s local checks.
For a full property model, use the multifamily calculator. The single-family calculator supports a separate 1–4-unit workflow. These links do not transfer this page’s inputs; re-enter and verify your assumptions.
Compare local screening context: Philadelphia County · Allegheny County · Montgomery County. County rent-to-price screens are modeled indexes, not matched closed-sale NOI caps. Explore the Pennsylvania market directory.
Questions before an offer
Is 7.5% a good Pittsburgh cap rate?
It is a dated average from a predominantly Class C trading pool. Evaluate the actual NOI convention, capital work and debt coverage before calling the property attractive.
Can I use Philadelphia’s rate in the Lehigh Valley?
Only as broad context. This edition has no matching Lehigh Valley cap sample; seek local closed sales rather than inventing a geographic adjustment.
Does falling vacancy mean prices will rise?
It can support income, but values still depend on buyer expenses, financing and the multiple buyers pay. The cap rate may remain flat or widen.
Source ledger, dates and refresh rules
Research retrieved October 18, 2026. Observations, publisher outlooks and our conditional interpretation are labeled separately. This ledger summarizes publicly available research; it does not redistribute proprietary report datasets. Brokers may be selling services or properties; appraisal commentary is not a guarantee of future pricing.
Northmarq
Geography: Philadelphia publisher metro; includes non-PA geography. Period: Q2 / H1 2026. Published: 2026-08-28. Accessed: 2026-10-18.
Property scope: Multifamily / apartments; inventory limits stated in observation. Class: Not disclosed unless specified in observation or sample limits. Substantive review: 2026-10-18.
Provider: Northmarq; see PDF for provider by metric. Measure: Disclosed-sale average described as mid-5% range. Statistic: Publisher-reported observation.
NOI convention: Not disclosed; do not assume trailing or forward NOI. Sample: 16 total H1 trades; cap subset undisclosed. Weighting: Not disclosed unless specified in metric.
Limits: No exact numeric point or cap count; forward outlook is publisher opinion. Refresh: Next source edition, correction, or material change in the cited rule.
Northmarq Q2 report, pp. 1, 3–5
Geography: Philadelphia publisher market and named submarkets. Period: Q2 / H1 2026. Published: Not stated in PDF; linked August 28. Accessed: 2026-10-18.
Property scope: Multifamily / apartments; inventory limits stated in observation. Class: Not disclosed unless specified in observation or sample limits. Substantive review: 2026-10-18.
Provider: Yardi operations; REIS sales chart; Northmarq; BLS/Census context. Measure: Vacancy, asking rents, transaction mix and supply outlook. Statistic: Publisher-reported observation.
NOI convention: Not disclosed; do not assume trailing or forward NOI. Sample: Not disclosed. Weighting: Not disclosed unless specified in metric.
Limits: Submarket operating evidence does not establish submarket caps. Refresh: Next source edition, correction, or material change in the cited rule.
Northmarq Q2 report, pp. 1, 3–5
Geography: Pittsburgh publisher market. Period: Q2 / H1 2026. Published: Not stated in PDF; linked July 21. Accessed: 2026-10-18.
Property scope: Multifamily / apartments; inventory limits stated in observation. Class: Not disclosed unless specified in observation or sample limits. Substantive review: 2026-10-18.
Provider: CoStar sales; Yardi operations; Northmarq. Measure: H1 cap average approximately 7.5%; vacancy and asking rents. Statistic: Publisher-reported observation.
NOI convention: Not disclosed; do not assume trailing or forward NOI. Sample: Not disclosed. Weighting: Not disclosed unless specified in metric.
Limits: Almost all trades Class C; sample size, weighting and NOI undisclosed. Refresh: Next source edition, correction, or material change in the cited rule.
Northmarq
Geography: Pittsburgh / South Allegheny / Downtown / Beaver. Period: H1 2026. Published: 2026-07-21. Accessed: 2026-10-18.
Property scope: Multifamily / apartments; inventory limits stated in observation. Class: Not disclosed unless specified in observation or sample limits. Substantive review: 2026-10-18.
Provider: Same Northmarq Q2 report; not an independent source. Measure: Local distribution of sales. Statistic: Publisher-reported observation.
NOI convention: Not disclosed; do not assume trailing or forward NOI. Sample: Not disclosed. Weighting: Not disclosed unless specified in metric.
Limits: Geographic mix changes are not repeat-sale price changes. Refresh: Next source edition, correction, or material change in the cited rule.
CBRE
Geography: Philadelphia publisher market. Period: Q2 2026. Published: 2026-07-31. Accessed: 2026-10-18.
Property scope: Multifamily / apartments; inventory limits stated in observation. Class: Not disclosed unless specified in observation or sample limits. Substantive review: 2026-10-18.
Provider: CBRE; public summary does not disclose full lineage. Measure: Leasing and investment commentary. Statistic: Publisher-reported observation.
NOI convention: Not disclosed; do not assume trailing or forward NOI. Sample: Not disclosed. Weighting: Not disclosed unless specified in metric.
Limits: Distinct interpretation, not independent confirmation of cap observations. Refresh: Next source edition, correction, or material change in the cited rule.
City of Philadelphia OPA
Geography: Philadelphia parcels. Period: Current guidance accessed October 18, 2026. Published: Not stated. Accessed: 2026-10-18.
Property scope: Property guidance / resource; not a cap observation. Class: Not applicable. Substantive review: 2026-10-18.
Provider: City of Philadelphia. Measure: Abatement and exemption guidance. Statistic: Official guidance.
NOI convention: Not applicable (not a cap-rate observation). Sample: Not applicable. Weighting: Not applicable.
Limits: Program and parcel eligibility must be checked individually. Refresh: Next source edition, correction, or material change in the cited rule.
City of Philadelphia
Geography: Philadelphia rental property. Period: Current guidance accessed October 18, 2026. Published: Not stated. Accessed: 2026-10-18.
Property scope: Property guidance / resource; not a cap observation. Class: Not applicable. Substantive review: 2026-10-18.
Provider: City of Philadelphia. Measure: Rental license requirements. Statistic: Official guidance.
NOI convention: Not applicable (not a cap-rate observation). Sample: Not applicable. Weighting: Not applicable.
Limits: Not statewide guidance. Refresh: Next source edition, correction, or material change in the cited rule.
FEMA
Geography: Property-specific national flood map lookup. Period: Effective parcel map must be checked. Published: Continuously maintained. Accessed: 2026-10-18.
Property scope: Property guidance / resource; not a cap observation. Class: Not applicable. Substantive review: 2026-10-18.
Provider: FEMA. Measure: Flood mapping lookup. Statistic: Official mapping resource.
NOI convention: Not applicable (not a cap-rate observation). Sample: Not applicable. Weighting: Not applicable.
Limits: No insurance premium or complete risk conclusion inferred. Refresh: Next source edition, correction, or material change in the cited rule.
Refresh the affected figures and interpretation together when a new edition, correction or material operating rule appears. A retrieval or rebuild is not a new observation. Report a correction through RentalCalcs contact, including the source, edition, geography and affected claim.