What is the average rent in Illinois?
The tracked ZIP-index mean is $1,891, and the median is $1,874 across 270 eligible ZIPs from 29 source counties. The mean adds the ZIP indices and divides by the number of ZIPs. The median is the middle ZIP value. Neither statistic is the average rent paid by Illinois households.
The underlying Zillow Observed Rent Index (ZORI) measures typical asking rents across home types and sizes. Zillow weights observations within its index; this page then gives every covered ZIP one vote. See the repeat-rent methodology. This extra aggregation is not Zillow’s official Illinois series or a listing-weighted state average.
An apartment or house needs a matched comp set
The shared series cannot separate studios, one-bedroom apartments, larger homes or square-foot prices. It has one current stored observation per ZIP, not a compatible matched history for growth. Use current homes with the same size, type, condition and lease terms before pricing a unit.
Investment research · reviewed October 20, 2026
Chicago’s rent growth supports income, but tax and expense changes decide how much the owner keeps
Chicago’s Q2 apartment occupancy and rent growth are stronger than several nearby large markets. That is a demand argument, not an owner-margin guarantee. Outside Chicagoland, the state rent table is useful for discovery but does not supply the missing local operating evidence.
Underwriting conclusion. Underwrite Chicago with a buyer-specific expense budget, including tax uncertainty, before capitalizing rent growth. Treat Peoria and Rockford as separate diligence cases; do not transfer Chicago’s market growth, vacancy or transaction assumptions to them.
The 3.1% is historical provider-market evidence from MMG Q2 2026; applying it to this unit is an assumption, not a forecast. Break-even extra expenses equal $671.46. Debt, reserve contributions and initial capital work are outside this incremental NOI comparison.
The interpretations and conditional actions below are RentalCalcs editorial analysis. Source observations keep their own periods. They do not establish a purchase recommendation, a property’s permitted rent or current leasing results.
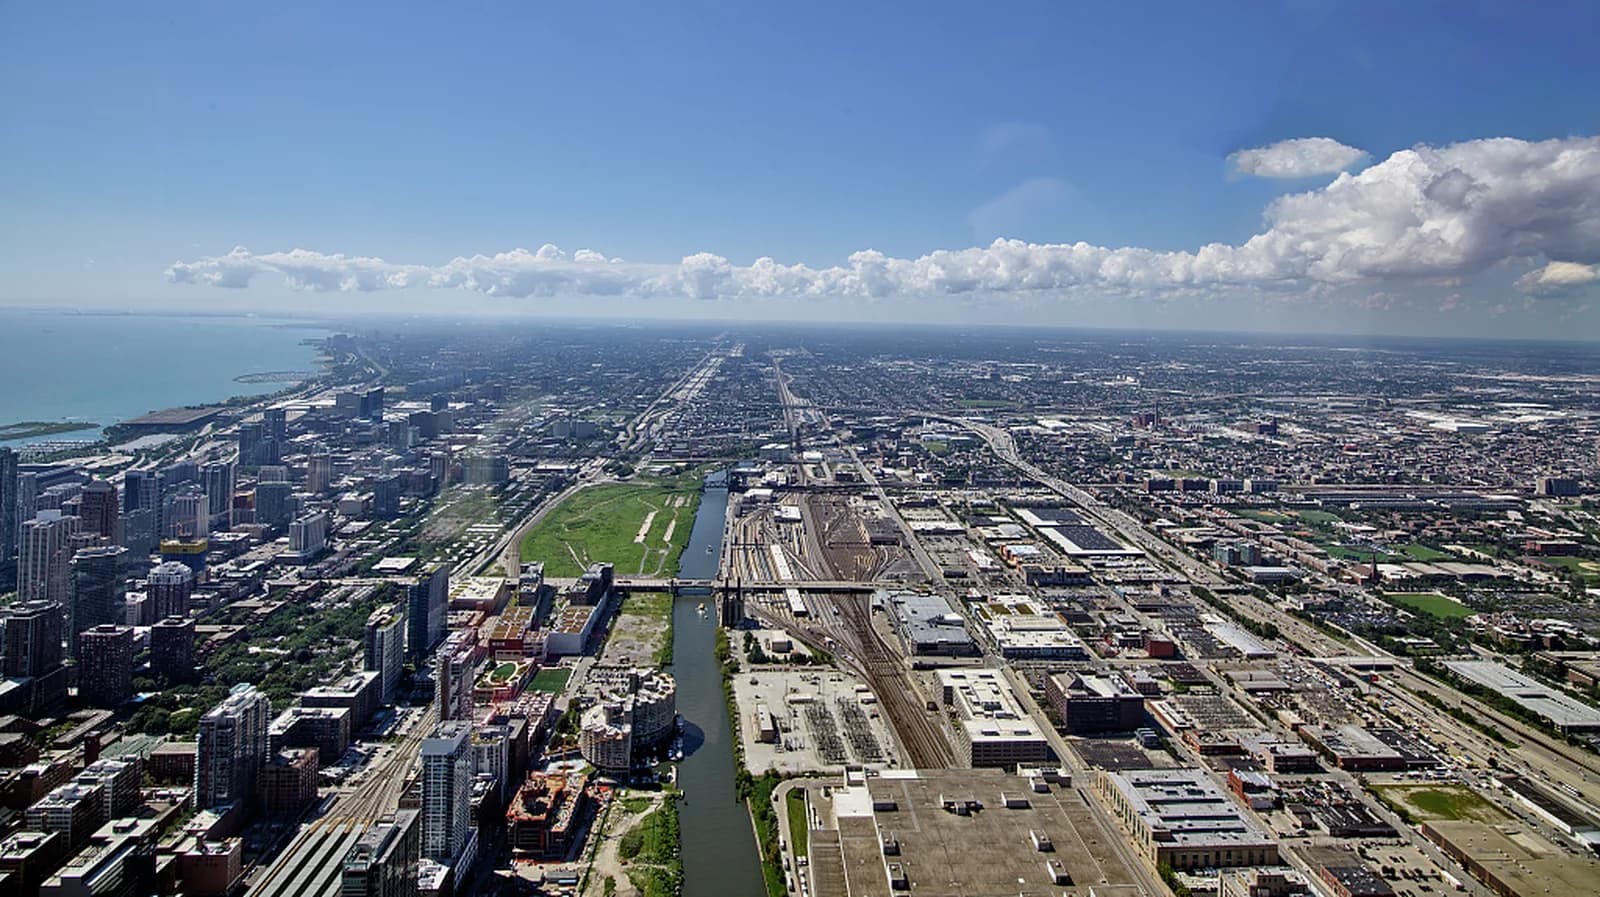
Chicago metro
A 3.1% rent increase leaves less protection when operating expenses also rise
MMG’s Q2 2026 report lists 95.4% stabilized apartment occupancy and 3.1% annual rent growth. Trailing completions of 5,600 units exceeded absorption of 3,499. Its construction pipeline was 1.6% of inventory.
- MMG Chicago Q2 2026 apartment report · Q2 2026; absorption and completions cover trailing four quarters · accessed October 20, 2026.
- Illinois Department of Revenue assessment appeals · Current tax mechanics: rates/levies and assessment are distinct; checked October 20, 2026 · accessed October 20, 2026.
High occupancy and positive rent growth support the income case, but they do not prove a particular building’s net income is improving. A tax or insurance increase comes out of revenue before debt service. Paying a premium for future growth can leave a thin cash margin even in a relatively firm leasing market.
Investment action. Compare current collected rent with a buyer expense budget before assigning a growth premium. Obtain the actual PIN, assessment/classification, tax bills and applicable exemptions; an assessment change alone is not a tax-bill forecast. Check neighborhood competitors rather than treating the lean metro pipeline as zero local supply.
What would change the conclusion. A verified low-expense property with durable occupancy may retain more growth. A new local lease-up or a larger tax burden can weaken it. We do not equate the broker’s apartment cohort with small buildings, houses or the City of Chicago boundary.
Records to obtain. PIN-level tax and assessment records, buyer insurance quote, utilities, collections and itemized recurring/capital work.
Peoria and Rockford
Lower ZIP rents do not establish a stronger income yield than Chicago
The shared ZIP table supplies rent-index comparisons, not purchase prices, maintenance budgets or collections. Rockford’s municipal guidance requires rental-property registration. Peoria’s official plans provide housing-needs context, with source years that must be kept separate from the current ZIP indices.
- Rockford rental registration · Current municipal program · accessed October 20, 2026.
- Peoria official housing plans and reports · Plan periods differ; needs analysis is not a current property rent series · accessed October 20, 2026.
The missing side of a low-rent acquisition is often the cost to preserve legal, habitable income. Fixed work and turnover costs consume a larger share of a smaller rent roll. A low asking price is therefore a hypothesis to investigate, not a verified high-yield result.
Investment action. For a small-building search, pair current executed leases with actual sales and a priced repair plan in the same market. Verify Rockford registration and local inspection requirements. In Peoria, confirm the unit, tenant demand and collections directly rather than importing Chicago’s 3.1% rent-growth figure.
What would change the conclusion. A well-maintained building at a sufficiently low basis can produce a stronger cash return. This edition has no verified matched current apartment operating series for both cities, so it does not rank them or imply their vacancy is low. The buyer must supply the missing evidence before comparing yields.
Records to obtain. Local executed leases/sales, rental registration, inspection and unit count, contractor bids, tax/insurance estimates and rent receivables.

Peoria is a separate market for local rent and property research. This civic street view supplies location context; it is not a rental comparable or proof of employment demand.
April 2013 · Carol M. Highsmith / Library of Congress · Original photograph · No known publication restrictions. Proportionally resized and converted to WebP; no scene changes. Archival location context.For the purchase-price side, use the illinois cap-rate research with its own transaction dates and property cohorts. A cap rate from another sample should not be multiplied by this page’s ZIP index to value a property.
How much extra annual expense can Chicago rent growth actually cover?
The comparison below isolates the arithmetic behind the Chicago thesis. The separate editable budget uses invented per-apartment inputs. Its expense line includes property tax, insurance, management, repairs and owner-paid utilities; replace it with a buyer budget. Neither the default nor the stress percentage predicts the next tax bill.
Illustration · one apartment · first 12 months · USD. Editable assumptions, not observed market averages or an acquisition recommendation. All recurring amounts are allocated per apartment. No appreciation, sale proceeds or tax benefits are assumed.
Annual cash after operating costs, debt and reserve contribution
$1,660This is a positive illustration margin, before initial capital work, income tax and sale costs.
- Scheduled rent
- $22,800
- − Vacancy / noncollection
- -$1,140
- − Occupied-share concession
- -$0
- = Effective rental income
- $21,660
- − Operating expenses
- -$9,000
- = NOI before debt / reserves
- $12,660
- − Debt service
- -$10,000
- − Reserve contribution
- -$1,000
- = Annual cash margin
- $1,660
NOI excludes debt service and this worksheet’s reserve contribution. Initial renovation, acquisition costs and initial downtime are outside this annual operating illustration. Do not subtract the same vacancy, incentive or repair expense twice.
On a narrow screen, scroll the table sideways to compare all three expense budgets.
| Collected occupancy | Entered expenses | Expenses +10% | Expenses +20% |
|---|---|---|---|
| 95% | $1,660Cash remaining | $760Cash remaining | -$140Cash deficit |
| 90% | $520Cash remaining | -$380Cash deficit | -$1,280Cash deficit |
| 85% | -$620Cash deficit | -$1,520Cash deficit | -$2,420Cash deficit |
Occupancy here is the collected share of scheduled rent before incentives, not a count of occupied doors. At the entered costs, break-even collected occupancy is 87.7%. Debt-service coverage is 1.27× NOI / debt service; it excludes reserve contributions.
Do not bid up the property on gross rent growth until the resulting cash margin remains acceptable with a defensible tax and expense downside. An assessment appeal is not a guaranteed saving. A refinancing or exit valuation based on NOI needs its own financing and sale-cost assumptions.
Use the full property cash-flow calculator for the purchase price, financing terms and holding period. Review its expense and reserve conventions before transferring assumptions; this illustration does not automatically populate a deal.
Compare the Illinois county sets that fit your search
Cook, its northeastern neighbors and the rest of Illinois are broad starting points. The local cuts below separate Rockford, central Illinois and the Illinois sides of the St. Louis and Quad Cities areas. They are selected whole-county comparisons, not official metro boundaries or a complete set of Illinois regions.
September 2026 · equal ZIP weighting · first four rows are a selected preview, not a ranking. Scroll sideways for all columns.
| Area and source counties | ZIP median / month | ZIP mean / month | ZIPs |
|---|---|---|---|
| Cook CountyCook | $1,951 | $2,032 | 121 |
| Six northeastern counties outside CookDuPage, Kane, Kendall, Lake, McHenry, Will | $2,196 | $2,223 | 81 |
| Rockford comparisonWinnebago, Boone | $1,330 | $1,356 | 10 |
| Peoria comparisonPeoria, Tazewell, Woodford | $1,150 | $1,129 | 9 |
View six more county comparisons
| Area and source counties | ZIP median / month | ZIP mean / month | ZIPs |
|---|---|---|---|
| Bloomington–Normal · McLean CountyMcLean | $1,394 | $1,308 | 3 |
| Champaign CountyChampaign | $1,291 | $1,360 | 7 |
| Springfield · Sangamon CountySangamon | $1,200 | $1,395 | 4 |
| Decatur · Macon CountyMacon | $1,037 | $1,057 | 3 |
| Metro East · two Illinois countiesMadison, Saint Clair | $1,237 | $1,281 | 12 |
| Quad Cities · Rock Island County onlyRock Island | $1,000 | $1,007 | 3 |
Metro East here means Madison and Saint Clair counties; Missouri is outside the sample. Rock Island County is only part of the Quad Cities, with Iowa excluded. Missing counties or a small ZIP count should prompt more local comp research rather than a statewide substitute.
The McLean and Champaign county ZIP medians are $1,394 and $1,291. Those all-size county samples cannot price a particular campus-area bedroom, furnished lease or academic-year tenancy. Match the dates and lease length, and calculate all months you must pay.
Pooled medians are calculated from individual ZIPs, never by averaging county medians. Comparison rows use 270 eligible ZIPs sharing the newest included month; 0 eligible observations fall outside that month. Dollars are rounded only for display.
Find Chicago, Aurora and other Illinois city groups
City groups follow postal-city labels rather than municipal boundaries. A Chicago city lookup is narrower than Cook County; an Aurora or Naperville postal label does not by itself identify a single county. Keep the city page for its local ZIP spread, then check the actual home’s location.
12 matching cities. Preview ordered by tracked ZIP count, then name; not by affordability. Scroll the table sideways for all columns.
| Postal city | ZIP median / month | ZIP mean / month | ZIPs | Observation months |
|---|---|---|---|---|
| Chicago | $1,899 | $2,040 | 54 | September 2026 |
| Rockford | $1,199 | $1,247 | 7 | September 2026 |
| Aurora | $2,266 | $2,202 | 5 | September 2026 |
| Peoria | $1,166 | $1,184 | 5 | September 2026 |
| Naperville | $2,292 | $2,370 | 4 | September 2026 |
| Belleville | $1,229 | $1,175 | 3 | September 2026 |
| Champaign | $1,536 | $1,541 | 3 | September 2026 |
| Decatur | $1,037 | $1,057 | 3 | September 2026 |
View remaining 4 cities
| Postal city | ZIP median / month | ZIP mean / month | ZIPs | Observation months |
|---|---|---|---|---|
| Elgin | $1,730 | $1,882 | 3 | September 2026 |
| Oak Park | $1,952 | $1,935 | 3 | September 2026 |
| Schaumburg | $2,140 | $2,186 | 3 | September 2026 |
| Springfield | $1,207 | $1,479 | 3 | September 2026 |
Source: shared eligible ZORI ZIP indices. Only cities meeting the existing three-ZIP threshold get a page. Coverage order is not an affordability or investment ranking.
Search Illinois ZIP rent benchmarks
Use a ZIP or postal city, then narrow by county. Each row carries its own observation month. An absent ZIP is missing data, not zero rent or evidence of no available homes. Expand the table to inspect the complete eligible sample.
Newest included observation: September 2026. Historical retained ZIPs are excluded from current estimates after a validated refresh.
270 matching ZIPs, ordered by ZIP. Preview shows up to six. Scroll the table sideways for all columns.
| ZIP | Postal city | County | Monthly index | Observation |
|---|---|---|---|---|
| 60002 | Antioch | Lake County | $2,011 | September 2026 |
| 60004 | Arlington Heights | Cook County | $2,098 | September 2026 |
| 60005 | Arlington Heights | Cook County | $1,895 | September 2026 |
| 60007 | Elk Grove Village | Cook County | $1,833 | September 2026 |
| 60008 | Rolling Meadows | Cook County | $2,101 | September 2026 |
| 60010 | Barrington | Lake County | $3,125 | September 2026 |
View remaining 264 ZIP benchmarks
| ZIP | Postal city | County | Monthly index | Observation |
|---|---|---|---|---|
| 60013 | Cary | McHenry County | $2,583 | September 2026 |
| 60014 | Crystal Lake | McHenry County | $1,963 | September 2026 |
| 60015 | Deerfield | Lake County | $2,812 | September 2026 |
| 60016 | Des Plaines | Cook County | $2,079 | September 2026 |
| 60020 | Fox Lake | Lake County | $1,600 | September 2026 |
| 60025 | Glenview | Cook County | $2,746 | September 2026 |
| 60030 | Grayslake | Lake County | $2,299 | September 2026 |
| 60031 | Gurnee | Lake County | $1,956 | September 2026 |
| 60035 | Highland Park | Lake County | $3,147 | September 2026 |
| 60044 | Lake Bluff | Lake County | $2,058 | September 2026 |
| 60045 | Lake Forest | Lake County | $3,952 | September 2026 |
| 60046 | Lindenhurst | Lake County | $2,258 | September 2026 |
| 60047 | Kildeer | Lake County | $3,191 | September 2026 |
| 60048 | Libertyville | Lake County | $2,185 | September 2026 |
| 60050 | McHenry | McHenry County | $1,851 | September 2026 |
| 60051 | Lakemoor | McHenry County | $1,974 | September 2026 |
| 60053 | Morton Grove | Cook County | $2,532 | September 2026 |
| 60056 | Mount Prospect | Cook County | $1,832 | September 2026 |
| 60060 | Mundelein | Lake County | $2,358 | September 2026 |
| 60061 | Vernon Hills | Lake County | $2,587 | September 2026 |
| 60062 | Northbrook | Cook County | $2,687 | September 2026 |
| 60064 | North Chicago | Lake County | $1,823 | September 2026 |
| 60067 | Palatine | Cook County | $1,815 | September 2026 |
| 60068 | Park Ridge | Cook County | $2,404 | September 2026 |
| 60070 | Prospect Heights | Cook County | $1,712 | September 2026 |
| 60071 | Richmond | McHenry County | $1,300 | September 2026 |
| 60073 | Round Lake | Lake County | $2,494 | September 2026 |
| 60074 | Palatine | Cook County | $1,945 | September 2026 |
| 60076 | Skokie | Cook County | $2,113 | September 2026 |
| 60077 | Skokie | Cook County | $2,430 | September 2026 |
| 60085 | Waukegan | Lake County | $1,710 | September 2026 |
| 60087 | Waukegan | Lake County | $1,592 | September 2026 |
| 60089 | Buffalo Grove | Lake County | $2,402 | September 2026 |
| 60090 | Wheeling | Cook County | $2,028 | September 2026 |
| 60091 | Wilmette | Cook County | $3,794 | September 2026 |
| 60098 | Woodstock | McHenry County | $1,474 | September 2026 |
| 60099 | Zion | Lake County | $1,422 | September 2026 |
| 60101 | Addison | DuPage County | $1,844 | September 2026 |
| 60102 | Algonquin | McHenry County | $2,370 | September 2026 |
| 60106 | Bensenville | DuPage County | $1,871 | September 2026 |
| 60107 | Streamwood | Cook County | $2,471 | September 2026 |
| 60108 | Bloomingdale | DuPage County | $2,286 | September 2026 |
| 60110 | Carpentersville | Kane County | $2,297 | September 2026 |
| 60115 | Dekalb | DeKalb County | $1,320 | September 2026 |
| 60118 | West Dundee | Kane County | $2,419 | September 2026 |
| 60120 | Elgin | Cook County | $1,730 | September 2026 |
| 60123 | Elgin | Kane County | $1,598 | September 2026 |
| 60124 | Elgin | Kane County | $2,319 | September 2026 |
| 60126 | Elmhurst | DuPage County | $2,453 | September 2026 |
| 60130 | Forest Park | Cook County | $1,532 | September 2026 |
| 60133 | Hanover Park | DuPage County | $2,419 | September 2026 |
| 60134 | Geneva | Kane County | $2,002 | September 2026 |
| 60137 | Glen Ellyn | DuPage County | $2,162 | September 2026 |
| 60139 | Glendale Heights | DuPage County | $1,926 | September 2026 |
| 60140 | Hampshire | Kane County | $2,407 | September 2026 |
| 60143 | Itasca | DuPage County | $2,196 | September 2026 |
| 60148 | Lombard | DuPage County | $2,094 | September 2026 |
| 60153 | Maywood | Cook County | $1,419 | September 2026 |
| 60155 | Broadview | Cook County | $1,325 | September 2026 |
| 60156 | Lake in the Hills | McHenry County | $2,184 | September 2026 |
| 60160 | Melrose Park | Cook County | $1,441 | September 2026 |
| 60169 | Hoffman Estates | Cook County | $2,013 | September 2026 |
| 60171 | River Grove | Cook County | $1,932 | September 2026 |
| 60172 | Roselle | DuPage County | $2,190 | September 2026 |
| 60173 | Schaumburg | Cook County | $2,140 | September 2026 |
| 60174 | Saint Charles | Kane County | $1,952 | September 2026 |
| 60177 | South Elgin | Kane County | $2,392 | September 2026 |
| 60178 | Sycamore | DeKalb County | $1,811 | September 2026 |
| 60181 | Villa Park | DuPage County | $2,057 | September 2026 |
| 60187 | Wheaton | DuPage County | $2,269 | September 2026 |
| 60188 | Carol Stream | DuPage County | $1,845 | September 2026 |
| 60189 | Wheaton | DuPage County | $2,506 | September 2026 |
| 60193 | Schaumburg | Cook County | $2,051 | September 2026 |
| 60194 | Schaumburg | Cook County | $2,367 | September 2026 |
| 60195 | Hoffman Estates | Cook County | $1,788 | September 2026 |
| 60201 | Evanston | Cook County | $2,762 | September 2026 |
| 60202 | Evanston | Cook County | $1,966 | September 2026 |
| 60301 | Oak Park | Cook County | $2,315 | September 2026 |
| 60302 | Oak Park | Cook County | $1,952 | September 2026 |
| 60304 | Oak Park | Cook County | $1,539 | September 2026 |
| 60305 | River Forest | Cook County | $2,200 | September 2026 |
| 60402 | Berwyn | Cook County | $1,448 | September 2026 |
| 60403 | Crest Hill | Will County | $2,010 | September 2026 |
| 60406 | Blue Island | Cook County | $1,421 | September 2026 |
| 60409 | Calumet City | Cook County | $1,536 | September 2026 |
| 60411 | Chicago Heights | Cook County | $1,694 | September 2026 |
| 60415 | Chicago Ridge | Cook County | $1,544 | September 2026 |
| 60416 | Coal City | Grundy County | $1,350 | September 2026 |
| 60419 | Dolton | Cook County | $2,343 | September 2026 |
| 60425 | Glenwood | Cook County | $2,034 | September 2026 |
| 60429 | Hazel Crest | Cook County | $2,613 | September 2026 |
| 60430 | Homewood | Cook County | $1,969 | September 2026 |
| 60431 | Joliet | Will County | $2,700 | September 2026 |
| 60435 | Joliet | Will County | $1,526 | September 2026 |
| 60436 | Rockdale | Will County | $2,098 | September 2026 |
| 60438 | Lansing | Cook County | $1,637 | September 2026 |
| 60439 | Lemont | Cook County | $2,231 | September 2026 |
| 60440 | Bolingbrook | Will County | $2,673 | September 2026 |
| 60441 | Lockport | Will County | $2,192 | September 2026 |
| 60443 | Matteson | Cook County | $2,192 | September 2026 |
| 60445 | Midlothian | Cook County | $1,544 | September 2026 |
| 60446 | Romeoville | Will County | $2,073 | September 2026 |
| 60450 | Morris | Grundy County | $1,574 | September 2026 |
| 60452 | Oak Forest | Cook County | $2,140 | September 2026 |
| 60453 | Oak Lawn | Cook County | $1,717 | September 2026 |
| 60466 | Park Forest | Cook County | $1,857 | September 2026 |
| 60471 | Richton Park | Cook County | $1,651 | September 2026 |
| 60477 | Tinley Park | Cook County | $2,070 | September 2026 |
| 60478 | Country Club Hills | Cook County | $3,125 | September 2026 |
| 60480 | Willow Springs | Cook County | $2,423 | September 2026 |
| 60482 | Worth | Cook County | $1,515 | September 2026 |
| 60487 | Tinley Park | Cook County | $3,196 | September 2026 |
| 60502 | Aurora | DuPage County | $2,468 | September 2026 |
| 60503 | Aurora | Will County | $2,661 | September 2026 |
| 60504 | Aurora | DuPage County | $2,266 | September 2026 |
| 60505 | Aurora | Kane County | $1,619 | September 2026 |
| 60506 | Aurora | Kane County | $1,997 | September 2026 |
| 60513 | Brookfield | Cook County | $2,086 | September 2026 |
| 60514 | Clarendon Hills | DuPage County | $2,515 | September 2026 |
| 60515 | Downers Grove | DuPage County | $2,433 | September 2026 |
| 60516 | Downers Grove | DuPage County | $1,941 | September 2026 |
| 60517 | Woodridge | DuPage County | $1,636 | September 2026 |
| 60525 | La Grange | Cook County | $2,202 | September 2026 |
| 60527 | Willowbrook | DuPage County | $2,096 | September 2026 |
| 60532 | Lisle | DuPage County | $1,919 | September 2026 |
| 60538 | Montgomery | Kendall County | $2,391 | September 2026 |
| 60540 | Naperville | DuPage County | $2,272 | September 2026 |
| 60542 | North Aurora | Kane County | $2,442 | September 2026 |
| 60543 | Oswego | Kendall County | $2,447 | September 2026 |
| 60544 | Plainfield | Will County | $2,595 | September 2026 |
| 60555 | Warrenville | DuPage County | $2,257 | September 2026 |
| 60559 | Westmont | DuPage County | $1,871 | September 2026 |
| 60560 | Yorkville | Kendall County | $2,058 | September 2026 |
| 60561 | Darien | DuPage County | $2,388 | September 2026 |
| 60563 | Naperville | DuPage County | $2,095 | September 2026 |
| 60564 | Naperville | Will County | $2,801 | September 2026 |
| 60565 | Naperville | DuPage County | $2,312 | September 2026 |
| 60586 | Plainfield | Will County | $3,147 | September 2026 |
| 60601 | Chicago | Cook County | $3,042 | September 2026 |
| 60602 | Chicago | Cook County | $2,438 | September 2026 |
| 60603 | Chicago | Cook County | $2,382 | September 2026 |
| 60605 | Chicago | Cook County | $2,756 | September 2026 |
| 60606 | Chicago | Cook County | $2,794 | September 2026 |
| 60607 | Chicago | Cook County | $2,975 | September 2026 |
| 60608 | Chicago | Cook County | $1,914 | September 2026 |
| 60609 | Chicago | Cook County | $1,642 | September 2026 |
| 60610 | Chicago | Cook County | $2,905 | September 2026 |
| 60611 | Chicago | Cook County | $2,956 | September 2026 |
| 60612 | Chicago | Cook County | $2,328 | September 2026 |
| 60613 | Chicago | Cook County | $2,257 | September 2026 |
| 60614 | Chicago | Cook County | $2,869 | September 2026 |
| 60615 | Chicago | Cook County | $1,855 | September 2026 |
| 60616 | Chicago | Cook County | $1,857 | September 2026 |
| 60617 | Chicago | Cook County | $1,497 | September 2026 |
| 60618 | Chicago | Cook County | $2,240 | September 2026 |
| 60619 | Chicago | Cook County | $1,335 | September 2026 |
| 60620 | Chicago | Cook County | $1,305 | September 2026 |
| 60621 | Chicago | Cook County | $1,625 | September 2026 |
| 60622 | Chicago | Cook County | $2,534 | September 2026 |
| 60623 | Chicago | Cook County | $1,581 | September 2026 |
| 60624 | Chicago | Cook County | $1,662 | September 2026 |
| 60625 | Chicago | Cook County | $1,969 | September 2026 |
| 60626 | Chicago | Cook County | $1,720 | September 2026 |
| 60628 | Chicago | Cook County | $1,725 | September 2026 |
| 60629 | Chicago | Cook County | $1,404 | September 2026 |
| 60630 | Chicago | Cook County | $1,877 | September 2026 |
| 60631 | Chicago | Cook County | $1,807 | September 2026 |
| 60632 | Chicago | Cook County | $1,551 | September 2026 |
| 60633 | Chicago | Cook County | $1,688 | September 2026 |
| 60634 | Chicago | Cook County | $1,951 | September 2026 |
| 60636 | Chicago | Cook County | $1,447 | September 2026 |
| 60637 | Chicago | Cook County | $1,757 | September 2026 |
| 60638 | Chicago | Cook County | $1,577 | September 2026 |
| 60639 | Chicago | Cook County | $1,740 | September 2026 |
| 60640 | Chicago | Cook County | $1,983 | September 2026 |
| 60641 | Chicago | Cook County | $1,820 | September 2026 |
| 60642 | Chicago | Cook County | $2,712 | September 2026 |
| 60643 | Chicago | Cook County | $2,118 | September 2026 |
| 60644 | Chicago | Cook County | $1,312 | September 2026 |
| 60645 | Chicago | Cook County | $1,897 | September 2026 |
| 60646 | Chicago | Cook County | $1,908 | September 2026 |
| 60647 | Chicago | Cook County | $2,335 | September 2026 |
| 60649 | Chicago | Cook County | $1,281 | September 2026 |
| 60651 | Chicago | Cook County | $1,751 | September 2026 |
| 60652 | Chicago | Cook County | $2,553 | September 2026 |
| 60653 | Chicago | Cook County | $2,272 | September 2026 |
| 60654 | Chicago | Cook County | $2,879 | September 2026 |
| 60656 | Chicago | Cook County | $1,611 | September 2026 |
| 60657 | Chicago | Cook County | $2,480 | September 2026 |
| 60659 | Chicago | Cook County | $1,752 | September 2026 |
| 60660 | Chicago | Cook County | $1,900 | September 2026 |
| 60661 | Chicago | Cook County | $2,607 | September 2026 |
| 60706 | Harwood Heights | Cook County | $2,078 | September 2026 |
| 60707 | Elmwood Park | Cook County | $1,734 | September 2026 |
| 60712 | Lincolnwood | Cook County | $2,561 | September 2026 |
| 60714 | Niles | Cook County | $2,274 | September 2026 |
| 60803 | Alsip | Cook County | $1,535 | September 2026 |
| 60804 | Cicero | Cook County | $1,330 | September 2026 |
| 60805 | Evergreen Park | Cook County | $1,744 | September 2026 |
| 60827 | Riverdale | Cook County | $1,290 | September 2026 |
| 60901 | Kankakee | Kankakee County | $1,204 | September 2026 |
| 60914 | Bourbonnais | Kankakee County | $1,381 | September 2026 |
| 60915 | Bradley | Kankakee County | $1,500 | September 2026 |
| 60950 | Manteno | Kankakee County | $1,380 | September 2026 |
| 61021 | Dixon | Lee County | $1,113 | September 2026 |
| 61032 | Freeport | Stephenson County | $926 | September 2026 |
| 61073 | Roscoe | Winnebago County | $1,646 | September 2026 |
| 61101 | Rockford | Winnebago County | $1,192 | September 2026 |
| 61103 | Rockford | Winnebago County | $1,221 | September 2026 |
| 61104 | Rockford | Winnebago County | $1,112 | September 2026 |
| 61107 | Rockford | Winnebago County | $1,438 | September 2026 |
| 61108 | Rockford | Winnebago County | $1,489 | September 2026 |
| 61109 | Rockford | Winnebago County | $1,199 | September 2026 |
| 61111 | Loves Park | Winnebago County | $1,579 | September 2026 |
| 61114 | Rockford | Winnebago County | $1,075 | September 2026 |
| 61115 | Machesney Park | Winnebago County | $1,610 | September 2026 |
| 61201 | Rock Island | Rock Island County | $932 | September 2026 |
| 61244 | East Moline | Rock Island County | $1,000 | September 2026 |
| 61265 | Moline | Rock Island County | $1,090 | September 2026 |
| 61350 | Ottawa | La Salle County | $1,258 | September 2026 |
| 61554 | Pekin | Tazewell County | $901 | September 2026 |
| 61571 | Washington | Tazewell County | $1,269 | September 2026 |
| 61603 | Peoria | Peoria County | $1,166 | September 2026 |
| 61604 | Peoria | Peoria County | $1,084 | September 2026 |
| 61605 | Peoria | Peoria County | $856 | September 2026 |
| 61611 | East Peoria | Tazewell County | $923 | September 2026 |
| 61614 | Peoria | Peoria County | $1,218 | September 2026 |
| 61615 | Peoria | Peoria County | $1,598 | September 2026 |
| 61616 | Peoria Heights | Peoria County | $1,150 | September 2026 |
| 61701 | Bloomington | McLean County | $1,078 | September 2026 |
| 61704 | Bloomington | McLean County | $1,453 | September 2026 |
| 61761 | Normal | McLean County | $1,394 | September 2026 |
| 61801 | Urbana | Champaign County | $1,291 | September 2026 |
| 61802 | Urbana | Champaign County | $1,274 | September 2026 |
| 61820 | Champaign | Champaign County | $1,264 | September 2026 |
| 61821 | Champaign | Champaign County | $1,536 | September 2026 |
| 61822 | Champaign | Champaign County | $1,822 | September 2026 |
| 61832 | Danville | Vermilion County | $887 | September 2026 |
| 61866 | Rantoul | Champaign County | $921 | September 2026 |
| 61874 | Savoy | Champaign County | $1,409 | September 2026 |
| 61920 | Charleston | Coles County | $762 | September 2026 |
| 62002 | Alton | Madison County | $1,004 | September 2026 |
| 62025 | Edwardsville | Madison County | $1,588 | September 2026 |
| 62034 | Glen Carbon | Madison County | $1,425 | September 2026 |
| 62040 | Granite City | Madison County | $1,162 | September 2026 |
| 62095 | Wood River | Madison County | $1,156 | September 2026 |
| 62206 | Cahokia Heights | Saint Clair County | $1,370 | September 2026 |
| 62208 | Fairview Heights | Saint Clair County | $1,314 | September 2026 |
| 62220 | Belleville | Saint Clair County | $1,052 | September 2026 |
| 62221 | Belleville | Saint Clair County | $1,229 | September 2026 |
| 62226 | Belleville | Saint Clair County | $1,244 | September 2026 |
| 62234 | Collinsville | Madison County | $1,161 | September 2026 |
| 62269 | O Fallon | Saint Clair County | $1,661 | September 2026 |
| 62301 | Quincy | Adams County | $1,008 | September 2026 |
| 62521 | Decatur | Macon County | $1,139 | September 2026 |
| 62522 | Decatur | Macon County | $1,037 | September 2026 |
| 62526 | Decatur | Macon County | $994 | September 2026 |
| 62702 | Springfield | Sangamon County | $1,207 | September 2026 |
| 62703 | Springfield | Sangamon County | $1,192 | September 2026 |
| 62704 | Leland Grove | Sangamon County | $1,143 | September 2026 |
| 62711 | Springfield | Sangamon County | $2,039 | September 2026 |
| 62864 | Mount Vernon | Jefferson County | $992 | September 2026 |
| 62901 | Carbondale | Jackson County | $636 | September 2026 |
| 62959 | Marion | Williamson County | $1,113 | September 2026 |
For bedroom-specific gross-rent references, open the HUD rent lookup. FMR/SAFMR references, adopted payment standards and approved unit rents are different measures from asking-rent ZORI. No demand, vacancy or achievable rent is inferred from a ZIP index.
When comparing real listings, match bedrooms, floor area, property type, condition, parking, pets, included utilities and the full lease term. A refundable deposit affects cash needed; a nonrefundable fee affects the cost of that lease. Obtain the written amounts and payment dates.
A cheaper monthly trip can still leave the first lease more expensive
For a Chicago-area address comparison, quote the whole route before deciding what rent premium transit access can cover. Include feeder service, the correct Metra zones, station parking and your actual on-site days. Downstate readers can use the same arithmetic with their own local service and driving quotes; the sample does not assume Chicago fares apply statewide.
Use NITA’s fare and payment guide, the CTA fare chart and Pace fare details to check the products covering your trip. Metra fares use zones; different passes and add-ons have different validity. The calculator’s transit amount is a user assumption, not a quoted pass price.
- $1,800Home A recurring monthly cost
- 18 daysFirst whole driving-day count where A is cheaper monthly
- 22 daysFirst whole day count where A is cheaper over the 12-month term
Illustration: A = $1,700 rent + $100 transit/station costs each month, plus a $400 nonrefundable fee. B = $1,550 rent + $120 fixed trip costs + 30 round-trip miles × driving days × $0.25 running cost per mile, with no fee. A stays at $1,800/month. B changes with driving days. These are hypothetical costs, not observed market rents, fares or an official mileage allowance.
| Driving days / month | A monthly | B monthly | A 12-month total | B 12-month total |
|---|---|---|---|---|
| 0 | $1,800 | $1,670 | $22,000 | $20,040 |
| 8 | $1,800 | $1,730 | $22,000 | $20,760 |
| 16 | $1,800 | $1,790 | $22,000 | $21,480 |
| 20 | $1,800 | $1,820 | $22,000 | $21,840 |
Scroll sideways for all columns. At 20 driving days, A costs $20 less per month but still $160 more over the first year because of its $400 fee. At eight days, B’s recurring cost is $1,730. A fixed transit budget is not automatically the cheaper choice for a hybrid schedule.
Test the rent premium against your trip
Hypothetical Chicago-area comparison: Home A uses transit, Home B uses a car for the specified trips. These defaults are not local rents, published fares or an official mileage rate. Replace them with complete quotes. Inputs are not saved.
- Home A monthly recurring cost
- $1,800
- Home B monthly recurring cost
- $1,790
- Home A full-term cost, including fees
- $22,000
- Home B full-term cost, including fees
- $21,480
Home B costs $520 less over 12 months, including the entered fees.
The mathematical monthly-cost crossover is 17.3 driving days per month; including the one-time fee difference over this term, it is 21.8 days. A threshold below zero or above 31 lies outside the entered calendar-day range.
Monthly A = rent + transit/station costs. Monthly B = rent + parking/fixed trip costs + round-trip miles × driving days × running cost per mile. Full-term cost = monthly cost × months + nonrefundable fees. Refundable deposits and moving costs are excluded. Include any different insurance, financing or ownership costs in the fixed-cost fields; a fuel-only estimate is not total vehicle cost. Time, service reliability and future price changes are not priced here.
Travel time, accessibility, reliability and the ability to make the whole trip matter alongside cash. This model does not establish that you can sell a car or avoid all ownership costs. Households can explore renting versus buying; owners can inspect Illinois county market evidence and use verified rent comps in the rental cash-flow calculator.
Read-only freshness audit, October 20, 2026: the shared database’s 270 eligible state ZIPs matched the upstream September 2026 observation month. No upstream ZIP was missing from storage and no matched stored observation lagged the source. Storage also held 57 older June–August observations outside the current sample; 56 stored ZIPs were absent from the downloaded file. These are dated audit counts, not a promise of future coverage. The lookup’s displayed dates and counts follow the shared validated refresh. Quarterly apartment research elsewhere on this page uses its own named sources, periods and cohorts.
Source dates, coverage and limitations
Current eligible observations cover these months:
- September 2026: 270 ZIPs.
0 included observations have unknown dates. The table follows the shared monthly rent publication; historical retained rows are kept separately and excluded from current estimates. The comparison sections use only the newest common month. County-unspecified ZIPs, if any, remain separately labeled rather than assigned to a region.
Coverage is selective. ZIPs are not equally populated, county assignment is not an address boundary match, and neither the seven-county cut nor the local comparisons represent every home in those areas. Positive extremes are retained rather than silently trimmed. No bedroom rent, square-foot price, growth, future return or tenant demand is supplied by this dataset.
Sources: Zillow source data and ZORI methodology. Geography and transport sources are cited beside their uses. The coverage graphic uses shared observations; the trip diagram and worksheet use labeled hypothetical inputs. Photo credit and source appear with the image.
Content and usability reviewed : Illinois market theses, primary-source research, investor income stress, body photography and retained city/ZIP lookup. Automated data updates do not advance this editorial date. About RentalCalcs · Report a data issue.