

Illinois apartment cap-rate evidence
Northmarq reports Chicago apartment caps averaging approximately 6.0% in first-half 2026 sales, 25 basis points above its 2025 comparison. Q2 asking rents rose 2.5% annually, while vacancy increased to 5.4%. Stronger advertised rents and wider sale yields can coexist. This Chicago evidence is not an Illinois statewide cap rate.
Cap rate is annual net operating income (NOI) divided by price, before financing. The right comparison starts with the property type, legal income, observation period and source method. There is no defensible statewide average in this edition.
| Geography / source | Cap / comparison | Period / statistic | Coverage boundary |
|---|---|---|---|
| Chicago report market Northmarq — Chicago Q2 2026 | 6.0% +25 bps vs 5.75% | H1 2026 sales vs 2025 Approximate published average | The 5.75% 2025 comparator is implied by approximately 6.0% less the reported 25-bp increase; it is not a separately verified exact prior mean. About half of trades Class B; cap-reporting count and NOI basis undisclosed. Not a neighborhood cap. |
The displayed 2025 comparator is an arithmetic implication of approximately 6.0% and the publisher’s reported 25-bp increase, not a separately verified exact 2025 mean. Only one verified regional cap series is included. No statewide range is calculated. Its 2025 comparator is not a matched H1 2025 cohort. REIS operating observations and CoStar/RCA sales cover different concepts. Do not mix this average with an asking yield, small-house gross rent/value index or a professional survey. One percentage point equals 100 basis points. No incompatible series are averaged.
The underwriting implication: A rent increase does not establish a better buyer return until taxes, collections and recurring work are rebuilt. Compare lakefront, downtown and suburban income separately; obtain local sales before pricing downstate apartments.
What the evidence changes locally
| Geography / period | Measure / value | Basis and limits |
|---|---|---|
| Chicago Q2 2026 | Vacancy / monthly asking rent 5.4% / $2,060 | REIS report market; vacancy +30 bps YoY, asking rent +2.5% YoY Northmarq — Chicago Q2 2026 |
| Lincoln Park Q2 2026 | Vacancy 3.1% | Publisher submarket operating series, not a cap rate Northmarq — Chicago Q2 2026 |
| Lakeview / Rogers Park Q2 2026 | Vacancy 5.0% / 5.3% | Same report; annual changes −80 / −90 bps respectively Northmarq — Chicago Q2 2026 |
| Chicago H1 2026 / forecast 2026 | Deliveries / full-year forecast 2,413 completed / approximately 5,000 forecast | CoStar development series; forecast not completed inventory Northmarq — Chicago Q2 2026 |
Chicago metro: positive asking rents, wider transaction yields
Observed evidence. Northmarq’s Q2 report puts vacancy at 5.4%, up 30 bps annually, and monthly asking rent at $2,060, up 2.5%. Its H1 average sale cap is approximately 6.0%. The report cites REIS for operations and CoStar/RCA for sales.
A higher required yield can offset rent growth. The cap numerator also changes when buyers substitute their own tax, insurance and management budgets for the seller’s expenses. Neither advertised rents nor a sale average proves that a particular rent roll earns the published yield.
RentalCalcs interpretation. Segmented stabilization is a more defensible working case than assuming that Chicago’s rent story forces compression. Underwrite collected income first; require matched closed sales and executable financing before lowering an exit cap.
What would change the view. A changing Class B share can move the reported average. Consistent building cohorts, declining concession-adjusted vacancy and more competitive loan proceeds would make a compression case stronger.
Before an offer: Reconcile T12 collections to the rent roll, then replace seller costs. Keep one comparison at the asking price and another at the price supported by buyer NOI.
Evidence: Northmarq — Chicago Q2 2026 · CBRE — U.S. Cap Rate Survey H1 2026
Lincoln Park, Lakeview and Rogers Park: tight occupancy is not a uniform rent premium
Observed evidence. The same report identifies Lincoln Park vacancy at 3.1%, Lakeview at 5.0% and Rogers Park at 5.3%; the latter two improved 80 and 90 bps annually. These are operating observations, not local cap-rate samples.
Renewal performance and turnover costs determine how tight physical occupancy reaches cash flow. A low-vacancy building with an old heat plant can still have weaker buyer NOI than a building with a slightly higher vacancy allowance and tenant-paid utilities.
RentalCalcs interpretation. The evidence supports testing durable occupancy rather than adding an unsupported neighborhood price premium. Stabilization or compression needs comparable sale NOI and a cost plan as well as favorable leasing.
What would change the view. The report’s provider inventory may differ from a two-flat or a small courtyard building. Collected rent below scheduled rent, costly turnover or a tax correction would weaken the cash-flow benefit of low reported vacancy.
Before an offer: Compare utility responsibility, unit condition and renewal collections within the actual competitive set. Do not use the metro 6% cap as a published Lincoln Park, Lakeview or Rogers Park rate.
Evidence: Northmarq — Chicago Q2 2026
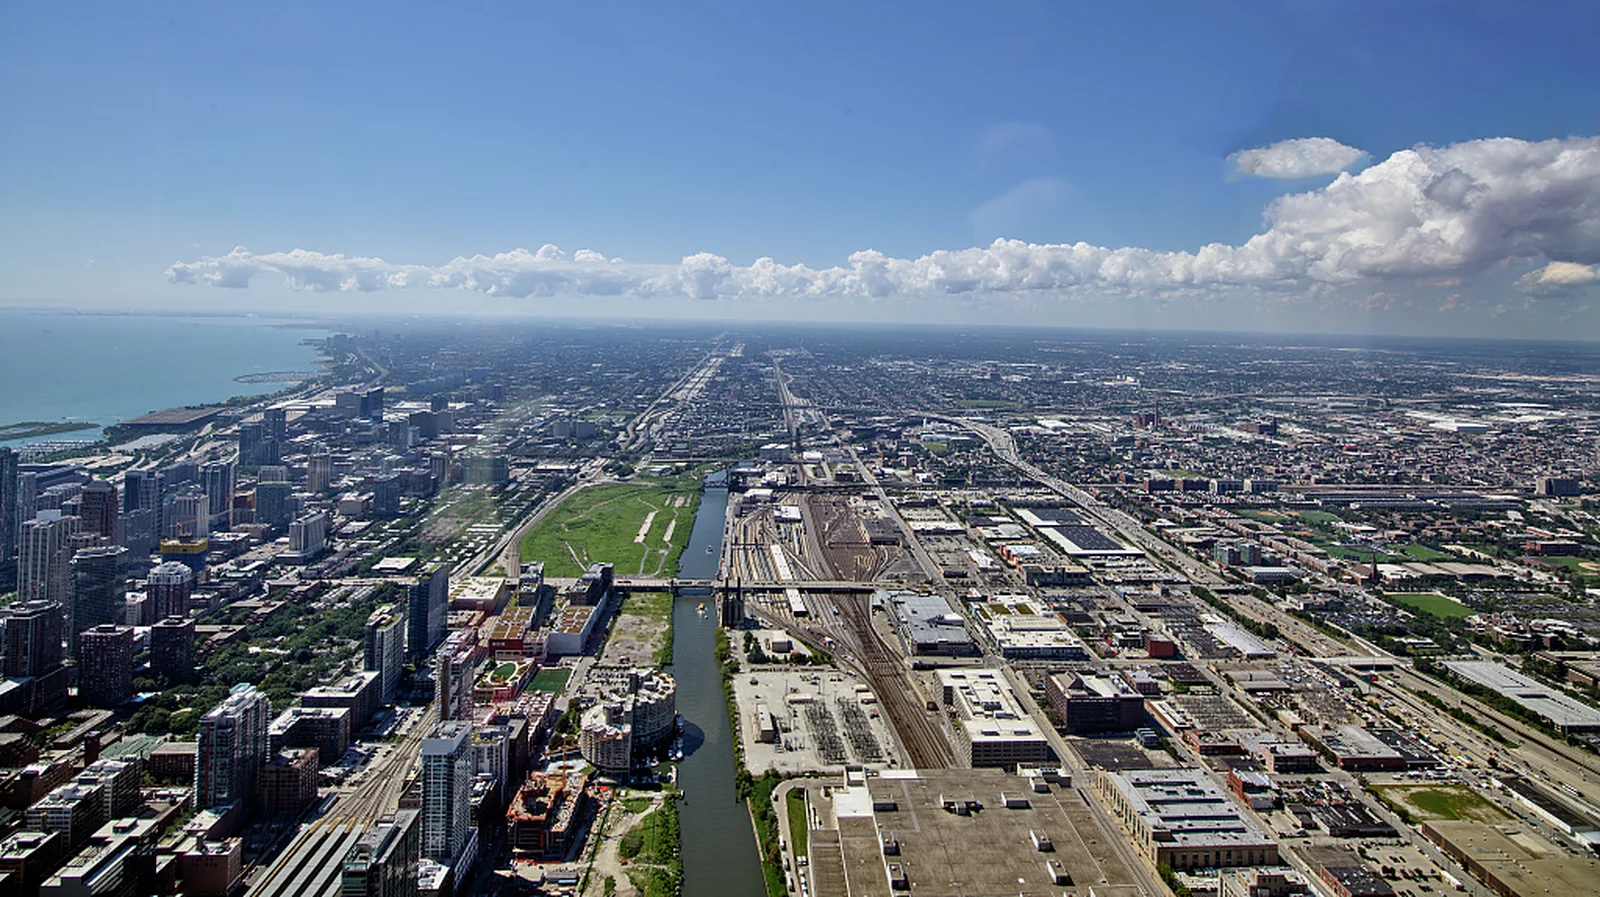
The Loop and nearby downtown markets: compare the premium with lease-up competition
Observed evidence. Northmarq identifies the Loop and surrounding districts as rent-growth leaders, with West Loop, South Loop, River North and Fulton Market showing about 5.5% average annual rent growth to more than $3,000 monthly. It forecasts about 5,000 metro deliveries in 2026; that is a forecast, not completed inventory.
Newer high-rent properties compete through amenities, concessions and lease timing. A renovation premium in an older asset needs support from tenants who will pay it after incentives, rather than from the newest tower’s advertised rent.
RentalCalcs interpretation. Compression is plausible for durable institutional income, but rent growth should not be capitalized twice through both aggressive NOI and a tighter exit. Retain a flat-cap reference and test effective rents if adjacent projects lease up.
What would change the view. Rising effective rents and sustained renewals after delivery would support the premium. Larger concessions, slower absorption or weaker job demand would reverse it even if the quoted asking rent remains high.
Before an offer: Collect current concession sheets and renewal terms for directly competing projects. Schedule turnover and amenity/capital costs before projecting rent gains.
Evidence: Northmarq — Chicago Q2 2026 · Colliers — Chicago midyear 2026
Suburban Chicago: a rail location is a comp characteristic, not a cap-rate adjustment
Observed evidence. Northmarq describes sales beyond downtown near Metra infrastructure and reports that approximately half of H1 transactions were Class B. It supplies no verified numerical cap for each suburban station area.
Transit access can affect a renter’s location choice, but a buyer must still distinguish garden apartments, renovated commuter stock and new transit-oriented construction. Cook County and neighboring counties also have different assessment systems; geographic convenience does not make their expense rows interchangeable.
RentalCalcs interpretation. A stable yield case needs consistent renewal collections and taxes under the buyer’s ownership. Any claim of compression at one station should be demonstrated through local closed sales rather than a metro rank.
What would change the view. A building relying on parking revenue or a particular employer can behave differently from the wider commuter market. Higher assessments, deferred work or incentives at nearby new supply would weaken the assumed income premium.
Before an offer: Request actual station-area comps, competing lease terms and parcel-level tax records. Match utility metering and building vintage before comparing NOI per unit.
Evidence: Northmarq — Chicago Q2 2026 · Cook County Assessor — How commercial properties are valued
Secondary markets, submarkets and the boundary of the data
Neighborhood cap rates need neighborhood sales with a documented NOI basis. Metro operating conditions can guide a property investigation; they cannot manufacture a local cap. These gaps matter when selecting comparable sales and budgeting liquidity.
| Market | Available evidence | What is missing | Next underwriting action |
|---|---|---|---|
| Cook, DuPage, Lake, Will and Kane suburban markets | Chicago report describes suburban sales and operating differences. | No verified matching 2026 cap sample by county or station. | Use property-specific buyer taxes and closed-sale NOI; Cook’s assessment level does not extend statewide. |
| Rockford | City FY2025–29 fair-housing analysis provides housing-needs context using older HUD/ACS data. | No current apartment cap series included; housing need is not demonstrated rent collectibility. | Investigate actual tenant income and collections, rehabilitation scope, local registration and comparable 5+-unit sales. |
| Champaign–Urbana | University of Illinois February 2026 housing study identifies campus-concentrated multifamily permitting. | No matched conventional-versus-student cap observations. | Separate per-bed student leases from per-unit conventional rents; test academic-year vacancy, guarantors, turnover and delivery timing. |
| Peoria / Springfield / Bloomington–Normal / Metro East | Peoria’s draft 2025–29 consolidated plan is housing-needs context, not pricing evidence. | No verified cap-rate cohort for these markets. St. Louis metro evidence is not automatically Illinois-only. | Match local employer exposure, neighborhood occupancy, tax districts and exit buyer pool. Request local closed-sale NOI before specifying a cap. |

County tools answer a different screening question. County housing context and rent-to-value models are not matched-property NOI caps: Cook County screening · DuPage County screening · Winnebago County screening · Champaign County screening.
Compression, stabilization or expansion?
Observed evidence: the Chicago series pairs rising rents with a higher H1 cap benchmark. This is consistent with financing or expense requirements absorbing operating gains, but the sale cohort cannot identify a single causal contribution. It does not establish that every Illinois apartment market is expanding.
Publisher forecast: Northmarq expects continued rent gains and modest vacancy improvement; its projected year-end operations are separate from observed Q2 values. Colliers’ midyear Chicago research provides another investment-market perspective, while shared industry data prevent treating every brokerage chart as independent confirmation.
Counterweight: CBRE’s June survey mostly favored unchanged yields nationally, with more dispersed views and greater Class C expansion concern. That sentiment does not contradict improving Chicago rents; it concerns the price buyers will pay for uncertain income.
RentalCalcs base case: hold the cap flat unless matched local evidence supports a different exit, and stress buyer taxes and effective collections. The meaningful question is whether recurring income can cover the property’s capital and debt commitments without refinancing relief.
Compression
Lease-up clears, collected rents rise and competitive lending allows investors to pay more for the same sustainable income.
Watch: Effective renewals, concession burn-off, matched cap-reporting sales and actual loan quotes.
Invalidated or weakened by: Growth concentrated in asking rents or trophy transactions while buyer tax and repair costs rise.
Underwrite: Treat a lower exit yield as upside; require the acquisition to survive a flat yield and expense correction.
Stabilization — working case
Rent gains compensate for buyer costs and debt requirements, leaving transaction yields near current levels.
Watch: Buyer NOI margins, suburban renewal rates, delivery absorption and assessment notices.
Invalidated or weakened by: Persistent expense growth above collected revenue or a broad move in matched sale yields.
Underwrite: Keep a flat exit cap and reserve for specific building systems; do not assume the entire rent increase reaches NOI.
Expansion
Higher taxes, weaker collections or refinancing constraints raise the yield buyers require, particularly where capital work is unfunded.
Watch: Tax changes, arrears, lender proceeds and actual repair bids.
Invalidated or weakened by: Stable buyer budgets and consistent comparable sales clearing at unchanged or tighter yields.
Underwrite: Stress lower NOI and a wider cap together; reduce the offer or equity commitment until coverage and liquidity work.
These are conditional editorial cases, not probabilities or publisher basis-point forecasts. A lower short-term policy rate does not guarantee a cheaper property loan: the Treasury curve, lender spread, amortization and proceeds all matter. Cap spreads alone do not measure total risk.
Separate the income decision from the cap-rate decision
Value = annual NOI ÷ (cap rate ÷ 100). At $140,000 NOI and a 7.00% cap, value is $2,000,000. Widening the cap by 100 basis points to 8.00%, with NOI unchanged, changes gross value by -12.5%. A one-point cap move is not a one-percent price move.
- Translate rent to receiptsCompare lakefront renewals, downtown incentives or suburban concessions within the property’s actual competition.
- Rebuild the tax lineUse the parcel’s assessment jurisdiction, equalization, district rates and benefits rather than a statewide percentage.
- Match the building and saleNormalize unit size, vintage, utility metering, buyer work and financing before interpreting a cap.
- Test the cash marginCombine a tax/insurance correction with a wider exit; reserve capital independently of recurring repairs.
Original underwriting sequence for Illinois. Choose an exit yield independently of the income growth needed to justify the deal.
| Cumulative NOI change | 6.00% exit cap | 7.00% exit cap | 8.00% exit cap | 9.00% exit cap |
|---|---|---|---|---|
| -10% total | +5.0% | -10.0% | -21.2% | -30.0% |
| 0% total | +16.7% | 0.0% | -12.5% | -22.2% |
| +10% total | +28.3% | +10.0% | -3.7% | -14.4% |
| +20% total | +40.0% | +20.0% | +5.0% | -6.7% |
Original calculations. This reference table does not change with the tool. NOI growth is cumulative, not annual. Simple property values exclude debt payoff, sale costs, income/capital-gains taxes and interim cash flows; they are not total investment returns.
One acquisition, one reconciled buyer budget
This hypothetical 20-unit purchase illustrates the report’s decision process; it is not a listing, appraisal or local cost quote. Replace each assumption with property evidence. Every line below belongs to the same acquisition.
| Budget line | Annual amount | Basis |
|---|---|---|
| Scheduled income | $336,000 | 20 units × $1,400 monthly × 12 |
| Vacancy, concessions and collection loss | −$26,880 | 8.0% of scheduled; one combined deduction |
| Effective collected income | $309,120 | Scheduled less combined loss |
| Buyer property taxes | $60,000 | Illustrative buyer expense; verify actual evidence |
| Insurance | $18,000 | Illustrative buyer expense; verify actual evidence |
| Management | $15,000 | Illustrative buyer expense; verify actual evidence |
| Recurring repairs | $26,000 | Illustrative buyer expense; verify actual evidence |
| Owner utilities | $22,000 | Illustrative buyer expense; verify actual evidence |
| Administration and recurring compliance | $28,120 | Illustrative buyer expense; verify actual evidence |
| Recurring expense total | $169,120 | Sum of six operating rows |
| NOI / going-in cap | $140,000 / 7.00% | Before debt, replacement reserve and income tax |
Cook County assessment percentage is not the tax rate
The Assessor describes a 10% level of assessment for multifamily housing, versus 25% for general commercial property. The tax bill also depends on equalization, rates and exemptions. Rebuild the buyer’s parcel bill and assessment cycle; do not apply either percentage to the purchase price as an annual tax. Other Illinois counties require their own records. Cook County Assessor — How commercial properties are valued.
Quote the actual commercial coverage
Illinois Department of Insurance commercial guidance is the starting point for policy review. Compare building replacement cost, water/flood exclusions, liability, ordinance-and-law and interruption coverage, deductibles and premium audit terms. Heating and roof replacement belong in a capital schedule as well as insurance diligence; the example premium is not a quote. Illinois Department of Insurance — Small business insurance.
Identify the governing local lease rules
Chicago’s Residential Landlord and Tenant Ordinance has its own scope and exclusions; it does not govern every Illinois municipality. Review notices, deposits, lease provisions and building compliance with the applicable local rules. Include recurring administration in NOI and separately budget the cost to cure existing violations. City of Chicago — Residential Landlord and Tenant Ordinance.
| Measure | Amount / treatment |
|---|---|
| Loan / interest / amortization | $1,100,000 / 6.5% / 30 years |
| Annual debt service | $83,433 |
| Replacement reserve below NOI | $12,000 per year |
| Invested cash | $1,060,000 = $900,000 down + $60,000 closing + $100,000 immediate capital work |
| Cash after debt and reserve | $44,567; cash-on-cash 4.20%, before income tax |
| DSCR / debt yield before reserves | 1.68× / 12.73% |
| DSCR after replacement reserve | 1.53×; confirm lender convention |
The mortgage constant is 7.58%. Lender sizing may be limited by coverage, leverage, debt yield or reserve-adjusted NOI. A hypothetical 1.25× coverage requirement before reserves would allow $112,000 annual debt service; this is a sizing illustration, not a universal lender rule. Yield on total acquisition cost, using current NOI and price plus closing and immediate work, is 6.48%. It differs from the going-in cap; future stabilized yield on cost would need a separate earned NOI and all carrying/rehabilitation costs.
Core report analysis is free. Enter your assumptions again in the linked calculator; they do not transfer automatically. A tool click is separate from a completed calculation or saved analysis.
Before relying on Illinois cap-rate evidence
Is 6% a good Illinois cap rate?
It is a dated Chicago report benchmark, not a pass/fail rule. A tax correction or recurring cost omission can remove much of that yield. Start with sustainable buyer NOI and match the comp, then test debt coverage and required capital.
Where are the downstate neighborhood cap rates?
This edition does not have verified matching NOI sale samples. The coverage matrix states the missing evidence and the local next steps. Chicago’s institutional sale cohort cannot fill Rockford, Peoria or student-housing tables.
Why can rent growth and expanding caps appear together?
The numerator and denominator answer different questions. Rents may improve while buyers require a higher return because borrowing costs, taxes or capital risk rise. Changes in the traded building mix can also move the average.
Keep the evidence with the offer
Record the comp basis, buyer budget, debt sizing, capital work and the fact that would change your thesis.
Open the free printable Illinois worksheetCheck what belongs in NOI · Compare California’s separately researched report · Illinois county directory
Sources, lineage and refresh policy
Accessed and substantively reviewed October 18, 2026. Each observation retains its actual period. Public summaries often omit cap-reporting sample size, NOI convention and weighting; no missing field is inferred. Brokerages have commercial advisory interests. Publications sharing CoStar, RCA/MSCI or one proprietary database do not establish independent corroboration.
Read the full source ledger, methods and refresh triggers
- Northmarq — Chicago Q2 2026
Observation / applicability: Q2 2026 operations; H1 sales versus 2025. Publication: September 2026 companion article. Access and review: October 18, 2026.
Underlying provider: Northmarq/REIS operations; CoStar development; Northmarq, CoStar and Real Capital Analytics sales Geography / asset: Publisher Chicago multifamily market; local operating observations are not neighborhood caps
Statistic, NOI, sample, weighting and limits: Approximate average cap 6%; about half of trades Class B. Cap sample size, weighting and NOI convention undisclosed. PDF pages 1, 3 and 4 checked; source forecasts clearly separate.
Refresh trigger: Q3 report or source correction.
- Colliers — Chicago midyear 2026
Observation / applicability: H1 2026. Publication: 2026 midyear edition. Access and review: October 18, 2026.
Underlying provider: Colliers research; underlying provider not established from landing page Geography / asset: Chicago multifamily investment research
Statistic, NOI, sample, weighting and limits: Contextual perspective only; no additional cap statistic imported or independence asserted.
Refresh trigger: Next edition or expanded methodology.
- CBRE — U.S. Cap Rate Survey H1 2026
Observation / applicability: Late June 2026 survey; six-month expectations. Publication: August 12, 2026. Access and review: October 18, 2026.
Underlying provider: More than 200 CBRE professionals; 3,600 estimates Geography / asset: National commercial-property sentiment
Statistic, NOI, sample, weighting and limits: Professional estimates and expectations; not a NY transaction series. No state probabilities inferred.
Refresh trigger: H2 survey or material financing change.
- Cook County Assessor — How commercial properties are valued
Observation / applicability: Guidance accessed October 18, 2026. Publication: Day not stated. Access and review: October 18, 2026.
Underlying provider: Cook County Assessor Geography / asset: Cook County assessment classes
Statistic, NOI, sample, weighting and limits: 10% multifamily assessment level; not an annual tax rate or statewide rule. Buyer bill requires equalization and taxing-district records.
Refresh trigger: Reassessment, exemption or adopted-rate change.
- Illinois Department of Insurance — Small business insurance
Observation / applicability: Current guidance at review. Publication: Day not stated. Access and review: October 18, 2026.
Underlying provider: Illinois DOI Geography / asset: Commercial coverage reference
Statistic, NOI, sample, weighting and limits: Coverage diligence only; no apartment premium forecast.
Refresh trigger: Binding policy, renewal and updated guidance.
- City of Chicago — Residential Landlord and Tenant Ordinance
Observation / applicability: Current guidance at review. Publication: Day not stated. Access and review: October 18, 2026.
Underlying provider: City of Chicago Geography / asset: Covered Chicago residential tenancies; exclusions apply
Statistic, NOI, sample, weighting and limits: Local applicability must be determined; not statewide tenancy advice.
Refresh trigger: Ordinance amendment or property applicability review.
- City of Rockford — FY2025–29 fair-housing analysis
Observation / applicability: Planning cycle FY2025–29; underlying data older. Publication: 2025 planning document. Access and review: October 18, 2026.
Underlying provider: City; older HUD/ACS evidence Geography / asset: Rockford housing needs
Statistic, NOI, sample, weighting and limits: Context only; no current observed NOI cap inferred from housing need.
Refresh trigger: New city housing analysis or apartment transaction evidence.
- University of Illinois — Improving housing affordability in Champaign County
Observation / applicability: Historical evidence through 2025. Publication: February 2026. Access and review: October 18, 2026.
Underlying provider: University research; local permit and housing data Geography / asset: Champaign County housing
Statistic, NOI, sample, weighting and limits: Campus concentration context; per-bed student leases not treated as conventional apartment rents. No cap sample.
Refresh trigger: New housing/permit evidence.
- City of Peoria — Draft 2025–29 consolidated plan
Observation / applicability: 2025–29 planning cycle; historical underlying observations. Publication: Draft 2025. Access and review: October 18, 2026.
Underlying provider: City; HUD/ACS housing-needs data Geography / asset: Peoria housing needs
Statistic, NOI, sample, weighting and limits: Draft planning context only, not an adopted market forecast or transaction cap-rate series.
Refresh trigger: Final plan or new local investment evidence.
Research editions are checked against publisher directories; coverage gaps and unresolved contradictions remain beside the affected evidence. Photographs provide archival building/location context, not current property condition or appraised sale evidence. The original contribution is the comparison, underwriting logic and reproducible scenarios. Review dates advance only after substantive checking.
Send a correction with the source URL, geography and observation date.