
What is the average rent in Minnesota?
The tracked ZIP-index mean is $1,701 and the median is $1,669, across 149 eligible ZIPs assigned to 28 source counties. The mean adds each ZIP value and divides by the ZIP count; the median is the middle value. Every covered ZIP gets equal weight. These are not household-weighted rents, a census of listings or an official statewide median.
The underlying Zillow Observed Rent Index (ZORI) describes asking rents across home types and sizes. Zillow applies weights within its index, as described in the source methodology. This page adds equal-ZIP aggregation; it does not reproduce Zillow’s own state series.
For a one-bedroom apartment, get one-bedroom evidence
These all-size values cannot answer a studio, shared-room, one-bedroom or three-bedroom-house question. Match the property type, size, condition, lease length and included services using current comparable homes. No compatible bedroom split, square-foot price or matched growth series is supplied here.
Investment research · reviewed October 20, 2026
Twin Cities absorption is ahead of deliveries; Saint Paul coverage and Rochester lease-ups still change the property case
The Twin Cities apartment balance has improved, but that does not supply one rent-growth assumption for every Minnesota building. The next question is whether the subject shares that segment, is covered by Saint Paul’s ordinance, or competes with new Rochester lease-ups.
Underwriting conclusion. Use the Twin Cities supply improvement to investigate stabilized income, then underwrite the actual legal and competitive position. In Rochester, separate occupied properties from projects still leasing. In Duluth, historical scarcity supports investigation rather than a license to ignore condition and operating costs.
Absorption ÷ completions = 1.27×. MMG reports 94.7% stabilized occupancy and 2.7% annual rent growth separately; those cohorts are not a vacancy identity. MMG Twin Cities Q2 report. Figures are historical quarterly evidence, not the live ZIP sample.
The interpretations and conditional actions below are RentalCalcs editorial analysis. Source observations keep their own periods. They do not establish a purchase recommendation, a property’s permitted rent or current leasing results.
Minneapolis–Saint Paul apartment market
Absorption ahead of deliveries supports stabilization, without guaranteeing a renovation premium
MMG’s Q2 2026 report lists 5,372 absorbed apartments versus 4,240 completions over four quarters, 94.7% stabilized occupancy and 2.7% annual rent growth. It reports positive absorption in 34 of 37 submarkets.
- MMG Twin Cities Q2 2026 apartment report · Q2 2026; absorption and completions cover trailing four quarters · accessed October 20, 2026.
- Saint Paul rent-stabilization rules · Current city summary, amended effective June 13, 2025; reviewed October 20, 2026 · accessed October 20, 2026.
This is a stronger supply/demand balance than a delivery overhang, but it does not identify the rent of an older apartment after renovation. The income opportunity depends on whether current tenants and competitors support the proposed rent position.
Investment action. Favor documented occupancy and an expense budget that works without a large renovation premium. In Saint Paul, verify ordinance coverage, exemption status and the actual allowable process before projecting increases; the city’s ordinary rule is 3%, with exceptions. Do not automatically apply that rule to Minneapolis or all of Ramsey County.
What would change the conclusion. A new local delivery cluster or weaker renter demand could reverse the broad improvement. A documented exempt Saint Paul property can have a different legal path, but exemption does not guarantee market rent growth.
Records to obtain. Signed leases, current collections, competitive pipeline, certificate/coverage records, tax/insurance and owner-paid energy costs.
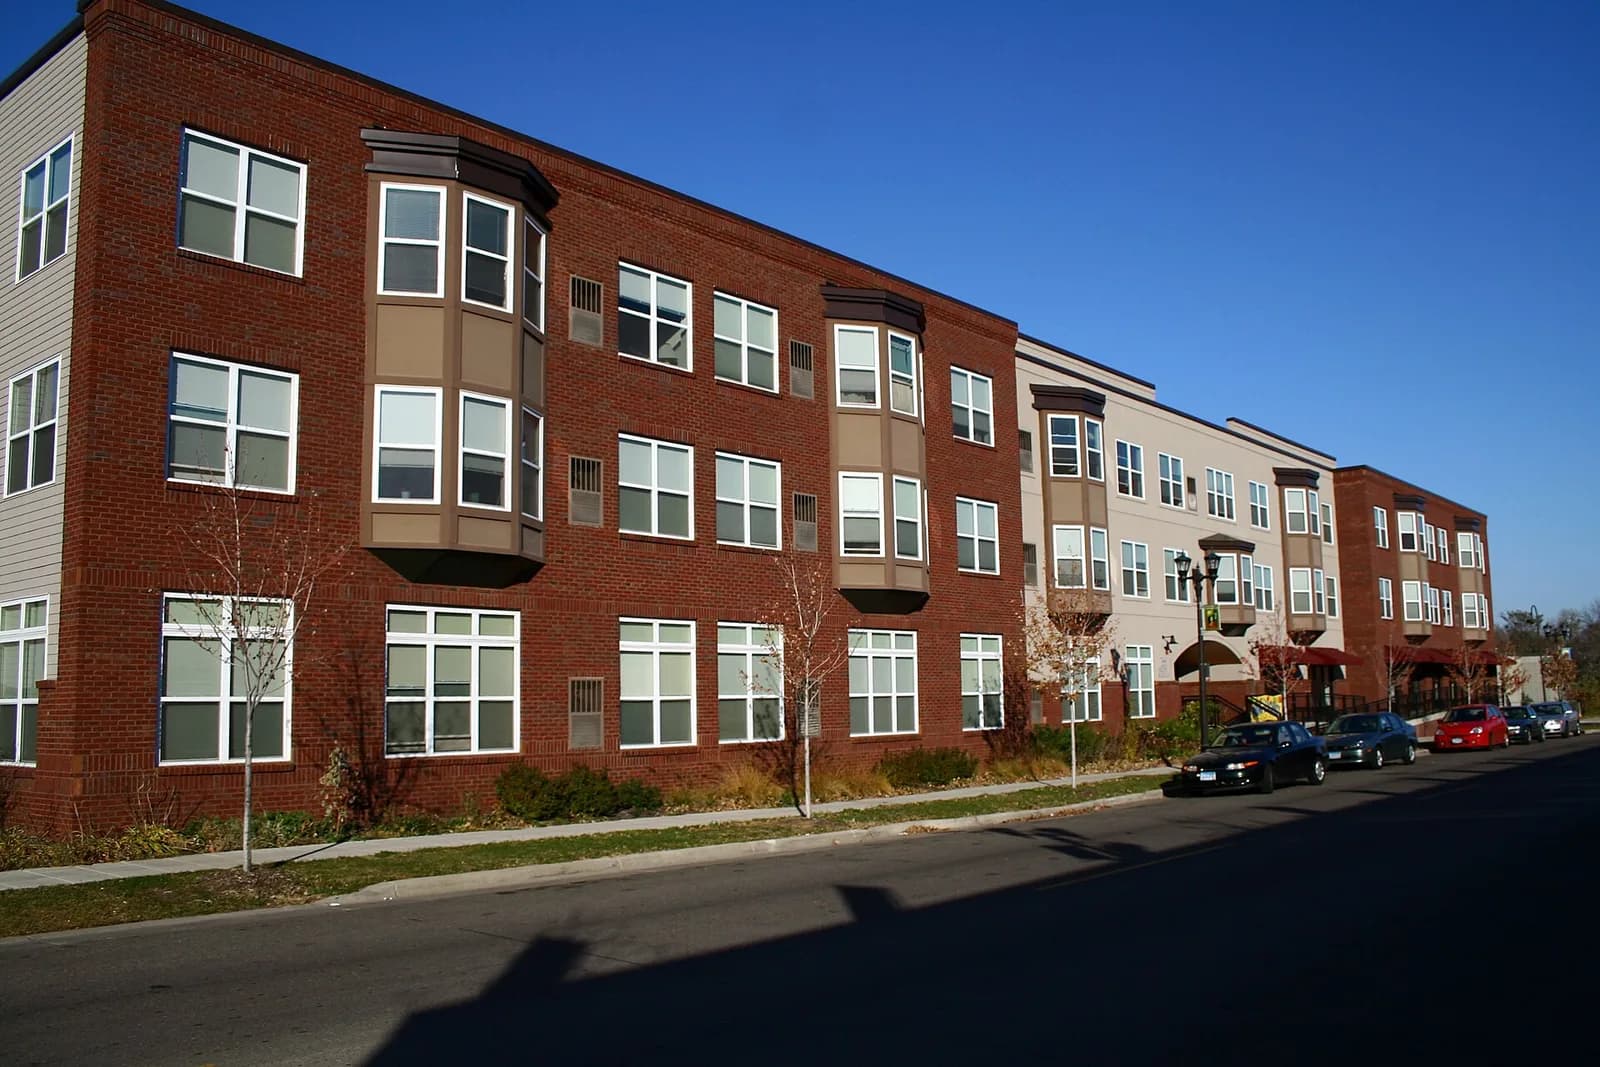
Saint Paul: the actual building and lease records determine ordinance coverage and collectible rent. This archival exterior does not establish exemption, current condition or available inventory.
October 29, 2006 · Michael Hicks · Original photograph · CC BY 2.0. Proportionally resized and converted to WebP; no scene changes. Archival location context.
Rochester / Olmsted County
Olmsted’s 2025 study reports 7.9% vacancy with lease-ups and 2.9% without them
The city-hosted 2025 Olmsted County study’s market-rate narrative (printed page 105) reports 7.9% vacancy including initial lease-ups and 2.9% excluding them. Those are different samples from the same historical survey. Other tables use different denominators; their unit counts and rates should not be combined to reconstruct this comparison.
- Olmsted County 2025 housing needs analysis, city-hosted revised draft · March 2025 report; April 28 transmittal; Q1 2025 rental survey, not current vacancy · accessed October 20, 2026.
The regional employment story is insufficient to choose a unit mix or assume immediate stabilization. A new apartment must acquire tenants; an established property must retain them. Those require different capital and leasing budgets even when the address is in the same market.
Investment action. For a new or heavily renovated property, obtain the competitive project schedule and monthly achieved leases, then fund an explicit absorption period. For an occupied building, verify renewal economics and repairs. Separate general-occupancy leases from furnished patient stays or short-term offers before comparing rents.
What would change the conclusion. Actual preleasing and a well-matched unit type can shorten the lease-up. A larger delivery cluster or unsupported furnished-rent assumption can lengthen it. The 2025 study is historical research, not a current forecast or an October vacancy observation.
Records to obtain. Current project roster, executed leases by unit type, lease-up cash schedule, required local rental approvals and operating budget.
Duluth
Historical scarcity supports a leasing case, but leaves the building-cost question unanswered
Duluth’s July 28, 2025 housing-study announcement reports 1.8% vacancy for surveyed market-rate properties. It is a historical survey result from a defined stock, not a 2026 vacancy estimate for every rental or a ZIP-index statistic.
- Duluth 2025 housing-study announcement · July 28, 2025; historical surveyed market-rate vacancy · accessed October 20, 2026.
Scarcity can support a demand investigation without telling an owner what it costs to maintain the property. A building requiring substantial near-term work can still produce weak cash income at a rent that appears strong relative to its purchase price.
Investment action. For an existing rental, verify current executed leases, inspection/licensing records, owner-paid heat, envelope and mechanical work before assigning value to rent growth. Keep a repair contingency and ask whether the unit can remain in service while work occurs. Use the historical vacancy only as context for that diligence.
What would change the conclusion. A current local survey or actual leasing performance can strengthen or weaken the scarcity thesis. Condition, utilities and a different rental segment may matter more than the citywide historical rate.
Records to obtain. Current comps and renewals, inspection, annual utility history, mechanical/roof bids and a downtime/capital plan.
Use the Minnesota market directory to find local purchase-market context, then obtain current comparable sales and subject expenses. This edition has no published Minnesota cap-rate report to supply a transaction benchmark.
Does a Minnesota unit retain a cash cushion when expenses outrun the rent?
Improving Twin Cities absorption and limits on some Saint Paul increases make expense resilience a useful second test. All defaults are assumed per-apartment annual inputs, not city observations. Start from the actual lawful rent and separately budget any initial Rochester lease-up or Duluth capital work.
Illustration · one apartment · first 12 months · USD. Editable assumptions, not observed market averages or an acquisition recommendation. All recurring amounts are allocated per apartment. No appreciation, sale proceeds or tax benefits are assumed.
Annual cash after operating costs, debt and reserve contribution
$970This is a positive illustration margin, before initial capital work, income tax and sale costs.
- Scheduled rent
- $18,600
- − Vacancy / noncollection
- -$930
- − Occupied-share concession
- -$0
- = Effective rental income
- $17,670
- − Operating expenses
- -$7,200
- = NOI before debt / reserves
- $10,470
- − Debt service
- -$8,500
- − Reserve contribution
- -$1,000
- = Annual cash margin
- $970
NOI excludes debt service and this worksheet’s reserve contribution. Initial renovation, acquisition costs and initial downtime are outside this annual operating illustration. Do not subtract the same vacancy, incentive or repair expense twice.
On a narrow screen, scroll the table sideways to compare all three expense budgets.
| Collected occupancy | Entered expenses | Expenses +10% | Expenses +20% |
|---|---|---|---|
| 95% | $970Cash remaining | $250Cash remaining | -$470Cash deficit |
| 90% | $40Cash remaining | -$680Cash deficit | -$1,400Cash deficit |
| 85% | -$890Cash deficit | -$1,610Cash deficit | -$2,330Cash deficit |
Occupancy here is the collected share of scheduled rent before incentives, not a count of occupied doors. At the entered costs, break-even collected occupancy is 89.8%. Debt-service coverage is 1.23× NOI / debt service; it excludes reserve contributions.
The relevant choice is whether verified income can carry the property through a cost increase or slower leasing. If it cannot, change the basis, financing or scope before relying on rent growth. This budget does not decide ordinance coverage, calculate a permitted increase or fund major initial repairs.
Use the full property cash-flow calculator for the purchase price, financing terms and holding period. Review its expense and reserve conventions before transferring assumptions; this illustration does not automatically populate a deal.
Minneapolis and Saint Paul postal groups within their counties
The county table pools more places than a city-name search. Separate the source’s Minneapolis-labeled ZIPs from other named places in Hennepin, and Saint Paul-labeled ZIPs from other named places in Ramsey. This changes the comparison before you make any adjustment for utilities or fees.
| Postal-label sample | County | ZIP median / month | ZIP mean / month | ZIPs |
|---|---|---|---|---|
| Minneapolis postal labels | Hennepin | $1,742 | $1,734 | 20 |
| Other named places in Hennepin | Hennepin | $1,836 | $1,955 | 34 |
| Saint Paul postal labels | Ramsey | $1,552 | $1,500 | 11 |
| Other named places in Ramsey | Ramsey | $1,530 | $1,638 | 8 |
Use the Minneapolis rent lookup or Saint Paul rent lookup for those postal groups. The gap between these samples does not measure what the same home would cost across a boundary; property mix and sparse ZIP coverage also differ.
Twin Cities, Rochester and Duluth county-set ZIP medians
The Metropolitan Council’s seven-county planning region contains Anoka, Carver, Dakota, Hennepin, Ramsey, Scott and Washington. Those counties contribute 110 of 149 newest-month ZIPs (73.8%). This is not the larger Minneapolis–Saint Paul interstate metro area, and the table does not turn the rest of Minnesota into one uniform market.
September 2026 · equal ZIP weights · first four rows are a selected preview, not a ranking. Scroll sideways for all columns.
| Comparison and source counties | ZIP median / month | ZIP mean / month | ZIPs |
|---|---|---|---|
| Hennepin CountyHennepin | $1,786 | $1,873 | 54 |
| Ramsey CountyRamsey | $1,547 | $1,558 | 19 |
| Five other Twin Cities planning countiesAnoka, Carver, Dakota, Scott, Washington | $1,858 | $1,894 | 37 |
| Rochester comparison · Olmsted CountyOlmsted | $1,601 | $1,603 | 4 |
View four more county comparisons
| Comparison and source counties | ZIP median / month | ZIP mean / month | ZIPs |
|---|---|---|---|
| Duluth comparison · Saint Louis CountySaint Louis | $1,336 | $1,359 | 7 |
| Saint Cloud comparison · three countiesStearns, Benton, Sherburne | $1,319 | $1,370 | 7 |
| Mankato comparison · two countiesBlue Earth, Nicollet | $1,205 | $1,205 | 2 |
| Moorhead comparison · Clay County onlyClay | $1,093 | $1,093 | 1 |
Saint Louis County includes places beyond Duluth; Wisconsin is excluded. The Saint Cloud comparison pools three whole counties, including places well beyond the city. Clay County is only the Minnesota side of the Fargo–Moorhead area; North Dakota is excluded. These selected county sets are neither official metro definitions nor a complete regional partition.
Rochester and Duluth: sparse postal-label coverage
The Clay County comparison currently has 1 ZIP observation. Keep the sample count with the rent. A missing or small sample is a reason to collect current matched quotes, not evidence of zero rent or low tenant demand.
Each pooled median is calculated from individual ZIP indices, never by averaging county medians. The postal-label and regional tables rows use only the newest common month. 0 included observations fall outside that month; 0 newest-month observations have unspecified counties.
Find a Minnesota postal-city group
City links retain the source’s postal-name task. The city-page gate requires at least three eligible ZIPs; a smaller place can still have an observation in the ZIP table. Counts show coverage, not popularity or the number of homes for rent. Filter for Minneapolis, Saint Paul, Bloomington, Duluth, Rochester or Saint Cloud.
10 matching cities. Preview ordered by tracked ZIP count, then name; not by affordability. Scroll the table sideways for all columns.
| Postal city | ZIP median / month | ZIP mean / month | ZIPs | Observation months |
|---|---|---|---|---|
| Minneapolis | $1,742 | $1,734 | 20 | September 2026 |
| Saint Paul | $1,552 | $1,500 | 11 | September 2026 |
| Bloomington | $1,689 | $1,672 | 5 | September 2026 |
| Duluth | $1,336 | $1,292 | 5 | September 2026 |
| Plymouth | $1,968 | $1,963 | 4 | September 2026 |
| Rochester | $1,601 | $1,603 | 4 | September 2026 |
| Eagan | $1,694 | $1,654 | 3 | September 2026 |
| Eden Prairie | $2,183 | $2,096 | 3 | September 2026 |
View remaining 2 cities
| Postal city | ZIP median / month | ZIP mean / month | ZIPs | Observation months |
|---|---|---|---|---|
| Edina | $1,963 | $2,251 | 3 | September 2026 |
| Saint Cloud | $1,176 | $1,148 | 3 | September 2026 |
Search the actual ZIP and check its date
A five-digit ZIP is a more precise lookup key than a regional label, though it still does not identify a comparable home. Filter by ZIP or postal city and county; clear the filters to return to all eligible Minnesota observations.
Newest included observation: September 2026. Historical retained ZIPs are excluded from current estimates after a validated refresh.
149 matching ZIPs, ordered by ZIP. Preview shows up to six. Scroll the table sideways for all columns.
| ZIP | Postal city | County | Monthly index | Observation |
|---|---|---|---|---|
| 55014 | Circle Pines | Anoka County | $1,960 | September 2026 |
| 55016 | Cottage Grove | Washington County | $1,827 | September 2026 |
| 55021 | Faribault | Rice County | $1,360 | September 2026 |
| 55024 | Farmington | Dakota County | $2,089 | September 2026 |
| 55025 | Forest Lake | Washington County | $1,573 | September 2026 |
| 55033 | Hastings | Dakota County | $1,630 | September 2026 |
View remaining 143 ZIP benchmarks
| ZIP | Postal city | County | Monthly index | Observation |
|---|---|---|---|---|
| 55038 | Hugo | Washington County | $2,456 | September 2026 |
| 55042 | Lake Elmo | Washington County | $2,758 | September 2026 |
| 55044 | Lakeville | Dakota County | $2,108 | September 2026 |
| 55045 | Lindstrom | Chisago County | $1,400 | September 2026 |
| 55057 | Northfield | Rice County | $1,756 | September 2026 |
| 55060 | Owatonna | Steele County | $1,081 | September 2026 |
| 55066 | Red Wing | Goodhue County | $1,443 | September 2026 |
| 55068 | Rosemount | Dakota County | $2,027 | September 2026 |
| 55075 | South Saint Paul | Dakota County | $1,534 | September 2026 |
| 55077 | Inver Grove Heights | Dakota County | $1,842 | September 2026 |
| 55082 | Stillwater | Washington County | $2,216 | September 2026 |
| 55101 | Saint Paul | Ramsey County | $1,527 | September 2026 |
| 55102 | Saint Paul | Ramsey County | $1,599 | September 2026 |
| 55103 | Saint Paul | Ramsey County | $1,417 | September 2026 |
| 55104 | Saint Paul | Ramsey County | $1,745 | September 2026 |
| 55105 | Saint Paul | Ramsey County | $1,554 | September 2026 |
| 55106 | Saint Paul | Ramsey County | $1,326 | September 2026 |
| 55107 | Saint Paul | Ramsey County | $1,559 | September 2026 |
| 55108 | Falcon Heights | Ramsey County | $1,512 | September 2026 |
| 55109 | Maplewood | Ramsey County | $1,498 | September 2026 |
| 55110 | White Bear Lake | Ramsey County | $1,880 | September 2026 |
| 55111 | Minneapolis | Hennepin County | $1,669 | September 2026 |
| 55112 | New Brighton | Ramsey County | $1,430 | September 2026 |
| 55113 | Roseville | Ramsey County | $1,547 | September 2026 |
| 55114 | Saint Paul | Ramsey County | $1,552 | September 2026 |
| 55116 | Saint Paul | Ramsey County | $1,602 | September 2026 |
| 55117 | Saint Paul | Ramsey County | $1,398 | September 2026 |
| 55118 | West Saint Paul | Dakota County | $1,477 | September 2026 |
| 55119 | Maplewood | Ramsey County | $1,438 | September 2026 |
| 55121 | Eagan | Dakota County | $1,496 | September 2026 |
| 55122 | Eagan | Dakota County | $1,694 | September 2026 |
| 55123 | Eagan | Dakota County | $1,771 | September 2026 |
| 55124 | Apple Valley | Dakota County | $1,985 | September 2026 |
| 55125 | Woodbury | Washington County | $1,982 | September 2026 |
| 55126 | Shoreview | Ramsey County | $1,912 | September 2026 |
| 55127 | Vadnais Heights | Ramsey County | $1,883 | September 2026 |
| 55128 | Oakdale | Washington County | $1,858 | September 2026 |
| 55129 | Woodbury | Washington County | $2,370 | September 2026 |
| 55130 | Saint Paul | Ramsey County | $1,225 | September 2026 |
| 55303 | Ramsey | Anoka County | $1,632 | September 2026 |
| 55304 | Andover | Anoka County | $2,477 | September 2026 |
| 55305 | Minnetonka | Hennepin County | $1,922 | September 2026 |
| 55306 | Burnsville | Dakota County | $1,420 | September 2026 |
| 55309 | Big Lake | Sherburne County | $1,547 | September 2026 |
| 55311 | Maple Grove | Hennepin County | $2,374 | September 2026 |
| 55313 | Buffalo | Wright County | $1,663 | September 2026 |
| 55316 | Champlin | Hennepin County | $1,865 | September 2026 |
| 55317 | Chanhassen | Carver County | $2,201 | September 2026 |
| 55318 | Chaska | Carver County | $1,848 | September 2026 |
| 55330 | Elk River | Sherburne County | $1,995 | September 2026 |
| 55331 | Shorewood | Hennepin County | $2,451 | September 2026 |
| 55337 | Burnsville | Dakota County | $1,505 | September 2026 |
| 55343 | Hopkins | Hennepin County | $1,647 | September 2026 |
| 55344 | Eden Prairie | Hennepin County | $1,767 | September 2026 |
| 55345 | Minnetonka | Hennepin County | $1,627 | September 2026 |
| 55346 | Eden Prairie | Hennepin County | $2,338 | September 2026 |
| 55347 | Eden Prairie | Hennepin County | $2,183 | September 2026 |
| 55362 | Monticello | Wright County | $1,700 | September 2026 |
| 55364 | Mound | Hennepin County | $2,464 | September 2026 |
| 55369 | Maple Grove | Hennepin County | $2,063 | September 2026 |
| 55372 | Prior Lake | Scott County | $2,059 | September 2026 |
| 55373 | Rockford | Wright County | $1,275 | September 2026 |
| 55374 | Rogers | Hennepin County | $2,173 | September 2026 |
| 55376 | Saint Michael | Wright County | $1,915 | September 2026 |
| 55378 | Savage | Scott County | $1,934 | September 2026 |
| 55379 | Shakopee | Scott County | $1,763 | September 2026 |
| 55386 | Victoria | Carver County | $2,184 | September 2026 |
| 55387 | Waconia | Carver County | $1,860 | September 2026 |
| 55391 | Woodland | Hennepin County | $3,392 | September 2026 |
| 55401 | Minneapolis | Hennepin County | $2,034 | September 2026 |
| 55402 | Minneapolis | Hennepin County | $1,735 | September 2026 |
| 55403 | Minneapolis | Hennepin County | $1,420 | September 2026 |
| 55404 | Minneapolis | Hennepin County | $1,461 | September 2026 |
| 55405 | Minneapolis | Hennepin County | $1,357 | September 2026 |
| 55406 | Minneapolis | Hennepin County | $1,407 | September 2026 |
| 55407 | Minneapolis | Hennepin County | $1,551 | September 2026 |
| 55408 | Minneapolis | Hennepin County | $1,488 | September 2026 |
| 55409 | Minneapolis | Hennepin County | $1,487 | September 2026 |
| 55410 | Minneapolis | Hennepin County | $2,352 | September 2026 |
| 55411 | Minneapolis | Hennepin County | $1,749 | September 2026 |
| 55412 | Minneapolis | Hennepin County | $1,730 | September 2026 |
| 55413 | Minneapolis | Hennepin County | $1,783 | September 2026 |
| 55414 | Minneapolis | Hennepin County | $2,160 | September 2026 |
| 55415 | Minneapolis | Hennepin County | $2,091 | September 2026 |
| 55416 | Saint Louis Park | Hennepin County | $1,873 | September 2026 |
| 55417 | Minneapolis | Hennepin County | $1,826 | September 2026 |
| 55418 | Minneapolis | Hennepin County | $1,760 | September 2026 |
| 55419 | Minneapolis | Hennepin County | $1,789 | September 2026 |
| 55420 | Bloomington | Hennepin County | $1,450 | September 2026 |
| 55421 | Columbia Heights | Anoka County | $1,601 | September 2026 |
| 55422 | Golden Valley | Hennepin County | $1,606 | September 2026 |
| 55423 | Richfield | Hennepin County | $1,396 | September 2026 |
| 55424 | Edina | Hennepin County | $2,985 | September 2026 |
| 55425 | Bloomington | Hennepin County | $1,669 | September 2026 |
| 55426 | Saint Louis Park | Hennepin County | $1,758 | September 2026 |
| 55427 | New Hope | Hennepin County | $1,788 | September 2026 |
| 55428 | New Hope | Hennepin County | $1,585 | September 2026 |
| 55430 | Brooklyn Center | Hennepin County | $1,455 | September 2026 |
| 55431 | Bloomington | Hennepin County | $1,805 | September 2026 |
| 55432 | Fridley | Anoka County | $1,412 | September 2026 |
| 55433 | Coon Rapids | Anoka County | $1,656 | September 2026 |
| 55434 | Blaine | Anoka County | $1,967 | September 2026 |
| 55435 | Edina | Hennepin County | $1,963 | September 2026 |
| 55436 | Edina | Hennepin County | $1,806 | September 2026 |
| 55437 | Bloomington | Hennepin County | $1,689 | September 2026 |
| 55438 | Bloomington | Hennepin County | $1,749 | September 2026 |
| 55441 | Plymouth | Hennepin County | $1,701 | September 2026 |
| 55442 | Plymouth | Hennepin County | $2,020 | September 2026 |
| 55443 | Brooklyn Park | Hennepin County | $1,771 | September 2026 |
| 55445 | Brooklyn Park | Hennepin County | $1,993 | September 2026 |
| 55446 | Plymouth | Hennepin County | $2,214 | September 2026 |
| 55447 | Plymouth | Hennepin County | $1,916 | September 2026 |
| 55448 | Coon Rapids | Anoka County | $1,734 | September 2026 |
| 55449 | Blaine | Anoka County | $2,170 | September 2026 |
| 55454 | Minneapolis | Hennepin County | $1,823 | September 2026 |
| 55792 | Virginia | Saint Louis County | $979 | September 2026 |
| 55802 | Duluth | Saint Louis County | $1,407 | September 2026 |
| 55805 | Duluth | Saint Louis County | $1,346 | September 2026 |
| 55806 | Duluth | Saint Louis County | $1,171 | September 2026 |
| 55808 | Duluth | Saint Louis County | $1,200 | September 2026 |
| 55811 | Hermantown | Saint Louis County | $2,073 | September 2026 |
| 55812 | Duluth | Saint Louis County | $1,336 | September 2026 |
| 55901 | Rochester | Olmsted County | $1,554 | September 2026 |
| 55902 | Rochester | Olmsted County | $1,668 | September 2026 |
| 55904 | Rochester | Olmsted County | $1,647 | September 2026 |
| 55906 | Rochester | Olmsted County | $1,542 | September 2026 |
| 55912 | Austin | Mower County | $1,161 | September 2026 |
| 55987 | Winona | Winona County | $1,065 | September 2026 |
| 56001 | Mankato | Blue Earth County | $1,259 | September 2026 |
| 56003 | North Mankato | Nicollet County | $1,150 | September 2026 |
| 56007 | Albert Lea | Freeborn County | $1,043 | September 2026 |
| 56143 | Jackson | Jackson County | $1,263 | September 2026 |
| 56201 | Willmar | Kandiyohi County | $912 | September 2026 |
| 56301 | Saint Cloud | Stearns County | $1,319 | September 2026 |
| 56303 | Saint Cloud | Stearns County | $949 | September 2026 |
| 56304 | Saint Cloud | Sherburne County | $1,176 | September 2026 |
| 56308 | Alexandria | Douglas County | $1,467 | September 2026 |
| 56377 | Sartell | Stearns County | $1,460 | September 2026 |
| 56387 | Waite Park | Stearns County | $1,143 | September 2026 |
| 56401 | Brainerd | Crow Wing County | $1,013 | September 2026 |
| 56537 | Fergus Falls | Otter Tail County | $909 | September 2026 |
| 56560 | Moorhead | Clay County | $1,093 | September 2026 |
| 56601 | Bemidji | Beltrami County | $1,144 | September 2026 |
For bedroom-specific federal gross-rent references, use the HUD rent lookup. HUD figures include utility assumptions and are not a bedroom split of ZORI, a local payment standard or an approved rent for this property.
A lower base rent can still produce a higher budget
Minnesota’s published fee-disclosure statute, section 504B.120, requires rent and nonoptional fees to be presented as the “Total Monthly Payment” on the first lease page, with nonoptional fees disclosed in advertising. It also requires disclosure of whether utilities are included. The Attorney General’s lease handbook explains utility responsibility and refundable security deposits. Check those written terms before treating two prices as comparable.
The disclosed rent-and-fee payment is one step in your budget. A utility billed separately or a service you choose can still change your cash requirement. The worksheet does not decide whether a charge is legally optional, permitted or properly disclosed.
Follow a quote from base rent to cash needed
Illustrative monthly costs; no local offer or typical fee is implied. Both examples cover a 12-month lease.
Home A
- Base rent $1,500
+ nonoptional fixed fees $140 - Rent-and-fee payment $1,640
+ outside monthly costs $110 - Complete monthly budget $1,750
× 12 = $21,000 term cost - Refundable deposit $1,500
First full month + deposit = $3,250
Home B
- Base rent $1,650
+ nonoptional fixed fees $0 - Rent-and-fee payment $1,650
+ outside monthly costs $60 - Complete monthly budget $1,710
× 12 = $20,520 term cost - Refundable deposit $800
First full month + deposit = $2,510
Home A’s base rent is $150 lower, yet its entered monthly budget is $40 higher and the 12-month cost is $480 higher. Home B also needs $740 less initial cash. The deposit is separate cash held; its difference is not an extra rent saving.
Holding the other example inputs fixed, Home A’s fixed-fee total reaches the same monthly budget as B at $100. Below that it is cheaper each month; above that it is more expensive. One-time nonrefundable costs can still change which lease costs less over the chosen term.
Reconcile two written quotes
Hypothetical prices, not local offers. Use the same lease length and services for both homes. Enter each charge once. Inputs stay in this page and are not saved.
Outside costs are utilities and any selected optional services excluded from rent and fixed fees. Do not enter an included utility twice. The deposit is counted as cash held, never assumed spent. One-time costs exclude refundable deposits.
Scroll the comparison sideways for both homes on a narrow screen.
| Measure | Home A | Home B |
|---|---|---|
| Rent + nonoptional fixed fees | $1,640 | $1,650 |
| Complete entered monthly budget | $1,750 | $1,710 |
| Term cost, excluding refundable deposit | $21,000 | $20,520 |
| First full month + deposit + one-time costs | $3,250 | $2,510 |
Home B costs $480 less over 12 months.
Home B requires $740 less initial cash under this first-full-month assumption. A lower deposit can improve cash availability without reducing the modeled rent expense.
Term cost = (rent + fixed fees + outside monthly costs) × months + one-time costs. Initial cash assumes one full month, the full deposit and entered one-time costs are due together; actual due dates, proration and installments can differ. This is a budget, not a legal compliance test. Deposit refunds, interest, damage deductions, borrowing costs and future price changes are not modeled.
For a household purchase decision, continue to the rent-versus-buy calculator using complete recurring costs. An owner evaluating rent income can use the rental-property cash-flow calculator; the ZIP index still needs matched unit evidence. Neither tool treats this disclosure worksheet as a legal rent limit.
Metro rent research
Read local rent trends, property strategies and acquisition downside analysis for each metro. Markets that span several states have one report.
- Minneapolis–St. Paul metro · MN / WI
Test the complete third-unit conversion budget before paying a seller for unbuilt rental income.
Read-only freshness audit, October 20, 2026: the shared database’s 149 eligible state ZIPs matched the upstream September 2026 observation month. No upstream ZIP was missing from storage and no matched stored observation lagged the source. Storage also held 30 older June–August observations outside the current sample; 30 stored ZIPs were absent from the downloaded file. These are dated audit counts, not a promise of future coverage. The lookup’s displayed dates and counts follow the shared validated refresh. Quarterly apartment research elsewhere on this page uses its own named sources, periods and cohorts.
Source months, retained ZIPs and what remains unknown
Current eligible observations cover these months:
- September 2026: 149 ZIPs.
0 included observations have unknown dates. Tables follow the shared monthly publication. Older retained rows remain separate from current estimates; ZIP comparison tables use the newest common month. Automated observation updates do not change the editorial review date.
ZIPs differ in population and rental stock. Source postal names and county assignments do not establish municipal boundaries, unit comparability, inventory, tenant demand or allowable lease increases. Positive extreme values are retained. Coverage gaps are not estimates of zero. All-size ZIP indices cannot supply compatible bedroom rents, square-foot prices or historical growth here.
Data: Zillow research downloads and ZORI methodology. Geography and lease-disclosure sources appear beside their claims. The city/county graphic uses shared data; the quote bridge and worksheet use hypothetical assumptions. The published statutory page is the 2025 edition, checked October 19, 2026; the worksheet does not verify an individual lease’s legal treatment.
Content and usability reviewed : Minnesota market theses, primary-source research, investor income stress, body photography and retained city/ZIP lookup. About RentalCalcs · Report a data issue.