Minneapolis–St. Paul rent & investment research · MN / WI
Minneapolis–St. Paul metro rent report
$1,736 per month is the typical asking rent in .
Minneapolis, MN provider market · Zillow metro ZORI · All homes and bedroom counts · Smoothed and seasonally adjusted
Buy Minneapolis’s existing rental income before paying for an unbuilt third unit.
By RentalCalcs editorial · Reviewed

The investment view
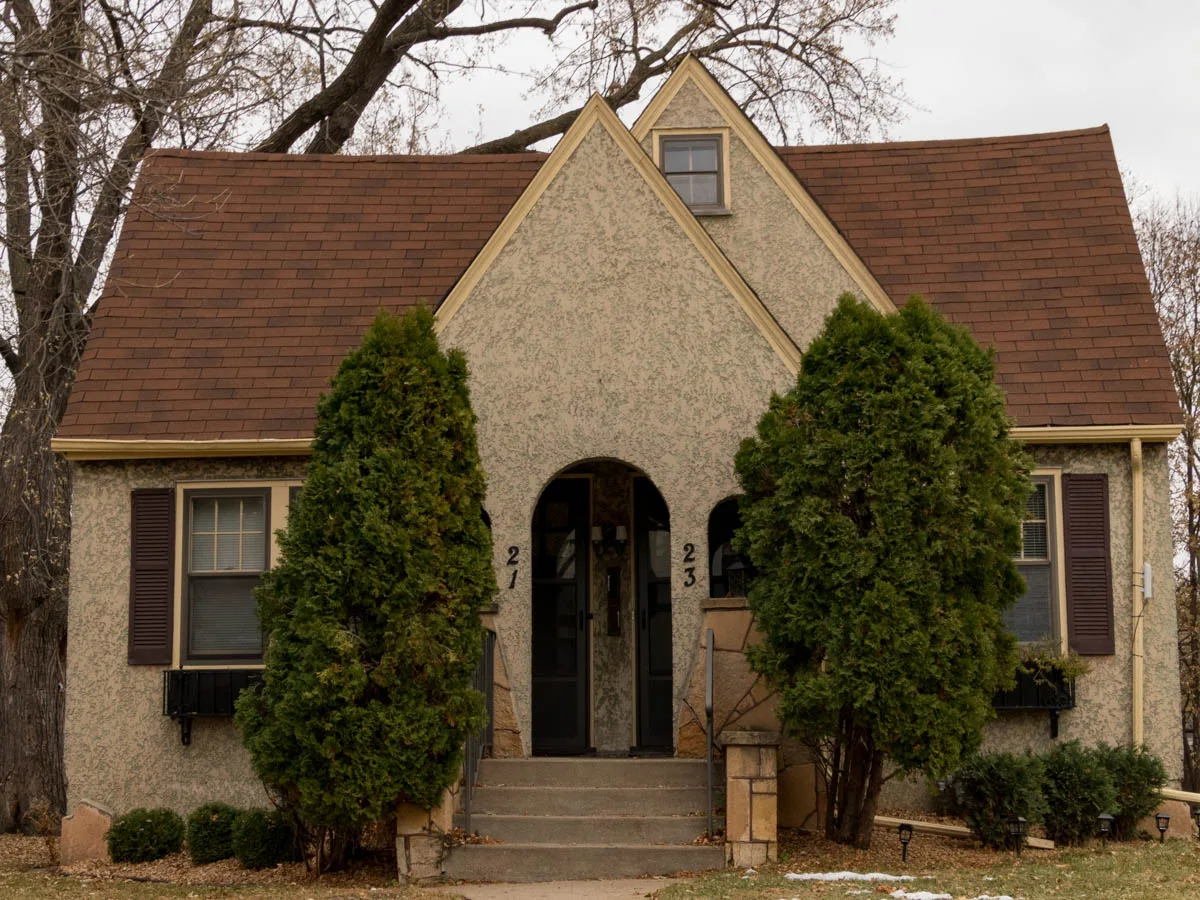
For a duplex or triplex buyer, a thinner apartment pipeline makes operating income worth investigating. It does not make a conversion premium self-funding. Favor documented legal units and collected rents; pay for another unit only when its permitted income clears a hurdle on the complete incremental cost.
Minneapolis–St. Paul’s metro rent is a benchmark across two states
Typical asking rent is $1,736 per month, +3.5% over one year and +10.5% over three. This Zillow market reaches across Minnesota and Wisconsin. Its county crosswalk adds Sibley County to the fifteen-county official 2023 metro definition; the headline follows the provider market rather than a reconstructed CBSA.
Monthly rent data (61 months)
| Month | Typical rent |
|---|---|
| September 2021 | $1,476 |
| October 2021 | $1,481 |
| November 2021 | $1,488 |
| December 2021 | $1,494 |
| January 2022 | $1,501 |
| February 2022 | $1,506 |
| March 2022 | $1,512 |
| April 2022 | $1,519 |
| May 2022 | $1,525 |
| June 2022 | $1,529 |
| July 2022 | $1,534 |
| August 2022 | $1,536 |
| September 2022 | $1,540 |
| October 2022 | $1,541 |
| November 2022 | $1,543 |
| December 2022 | $1,546 |
| January 2023 | $1,551 |
| February 2023 | $1,556 |
| March 2023 | $1,560 |
| April 2023 | $1,561 |
| May 2023 | $1,562 |
| June 2023 | $1,564 |
| July 2023 | $1,567 |
| August 2023 | $1,570 |
| September 2023 | $1,571 |
| October 2023 | $1,575 |
| November 2023 | $1,579 |
| December 2023 | $1,584 |
| January 2024 | $1,589 |
| February 2024 | $1,593 |
| March 2024 | $1,598 |
| April 2024 | $1,602 |
| May 2024 | $1,606 |
| June 2024 | $1,607 |
| July 2024 | $1,608 |
| August 2024 | $1,612 |
| September 2024 | $1,617 |
| October 2024 | $1,621 |
| November 2024 | $1,624 |
| December 2024 | $1,626 |
| January 2025 | $1,633 |
| February 2025 | $1,638 |
| March 2025 | $1,644 |
| April 2025 | $1,650 |
| May 2025 | $1,654 |
| June 2025 | $1,661 |
| July 2025 | $1,666 |
| August 2025 | $1,671 |
| September 2025 | $1,676 |
| October 2025 | $1,682 |
| November 2025 | $1,688 |
| December 2025 | $1,694 |
| January 2026 | $1,696 |
| February 2026 | $1,700 |
| March 2026 | $1,703 |
| April 2026 | $1,708 |
| May 2026 | $1,714 |
| June 2026 | $1,719 |
| July 2026 | $1,726 |
| August 2026 | $1,731 |
| September 2026 | $1,736 |
A broad rent index cannot set the rent for a basement apartment, a new third unit or a particular duplex. The investment question is narrower: how much can the next lawful lease contribute after its expenses, and how much capital must be committed before that lease starts?
The apartment pipeline contracted, but the rent gains are not uniform
| Observed measure | Result |
|---|---|
| Apartment vacancy | 4.6% |
| Average asking rent | $1,652/month; +3.5% annually |
| Units under construction | 4,585; 76% below 2022 peak |
| First-half deliveries | 1,964 units |
Northmarq reports suburban Class A and B asking-rent growth of 3.9% and 3.8% annually, while urban Class C asking rents fell 1.3%. That is a reason to inspect the actual competition, rather than assume every older city building participates equally in a metro recovery.
A smaller construction pipeline can reduce future competition if renter demand holds. Existing apartments can benefit sooner than a conversion that must still be designed, approved and built. The opposing risk is equally practical: a property with weak demand or an unsuitable layout may need a lower rent even while the regional average rises. Screen an existing building on leases of comparable size, location and utility responsibility.
At $1,700 rent, one additional unit supports about $203,000 of cost at a 6.5% hurdle
Assumed marginal unit · stabilized year
| Conversion cost | NOI / cost | Cash before debt / cost |
|---|---|---|
| $150,000 | 8.78% | 7.78% |
| $225,000 | 5.86% | 5.19% |
| $300,000 | 4.39% | 3.89% |
At $225,000, the unit earns $11,676 before debt after the reserve, and its NOI yield is only 5.86%. A seller’s price premium for the possibility of adding a unit consumes this same cost allowance. Spending it on the acquisition leaves less available for the conversion itself.
This is an incremental return, not the cap rate or value of the whole building. Attribute genuinely incremental utilities, tax changes, insurance, maintenance and management to the added unit. Include any rent lost from existing units during work. Existing land and building costs belong in the whole-property acquisition model; avoid counting them again here unless the conversion changes those costs.
The strongest conversion case is usable space with a short, approved work scope and independently supported rent. A lower complete cost or higher sustainable net income can reverse the preference for existing units. A high advertised rent without an approved layout, contractor scope and leasing evidence cannot.
Minneapolis’s permitting record separates legal capacity from completed investment
The Federal Reserve Bank of Minneapolis reports 317 units permitted in duplexes, triplexes and fourplexes during 2020–2025, compared with 12,335 in buildings of five or more units. These are city permitting cohorts, not the metro’s completed housing stock. Its study identifies development costs as a constraint; zoning permission alone does not establish financial feasibility.
| Permit year | Units |
|---|---|
| 2023 | 1,043 |
| 2024 | 351 |
| 2025 | 300 |
Do not turn that slowdown into a guaranteed rent forecast or attribute the rent path to one policy. For an offer, its practical use is to separate three things: permission for a unit, a financeable construction plan and occupied space paying rent. Pay the full income value only when the corresponding stage is established.
Saint Paul requires a different rent-history check


Saint Paul’s ordinary rent-stabilization limit is 3% in twelve months, with adjustment routes and exceptions. Current city rules exempt specified new construction first issued a certificate of occupancy after December 31, 2004, and specified nonresidential conversions. Adding a unit to an existing residential building does not by itself establish that exception.
Confirm the municipality, lawful unit records, prior rent and any documented exception or approved adjustment before underwriting a lease increase. Saint Paul offers a process to request certificate information. Do not apply its ordinance to the entire two-state metro or assume the older rolling twenty-year construction rule remains current. In Minneapolis, establish rental licensing and the relevant construction approvals separately.
An operating triplex must support its whole acquisition basis
Acquisition lab · assumed Minneapolis–St. Paul property
Editable assumptions, not an available listing or financing quote. Closing costs are fixed at 3% of purchase price; repairs are paid upfront. No appreciation, tax benefits, refinancing proceeds or rent growth are needed to generate the results.
Edit property assumptions
| Measure | Base | Downside |
|---|---|---|
| Scheduled rent | $68,400 | $64,980 |
| After vacancy / collection loss | $64,296 | $59,132 |
| Net operating income (NOI) | $41,296 | $33,832 |
| Annual loan payments | $24,909 | $24,909 |
| Cash after debt + capital reserve | $12,787 | $5,323 |
| Debt coverage (NOI ÷ payments) | 1.66× | 1.36× |
NOI excludes financing and capital reserves. Operating expenses must include taxes, insurance, management, routine maintenance and owner-paid utilities. A reserve reduces spendable cash; it does not make a known roof or sewer replacement disappear. Results describe a stabilized year after initial repairs. Fund renovation downtime and carrying costs separately; they are not estimated here.
| Required yield | Base NOI | Downside NOI |
|---|---|---|
| 6.5% | $573,129 | $461,640 |
| 7.5% | $490,887 | $394,263 |
| 8.5% | $427,995 | $342,739 |
A price below a yield ceiling can still fail debt coverage or require more cash than you have. Check the loan terms, unit-level leases and a contractor’s scope before treating a modeled ceiling as an offer.
The independent acquisition example assumes three existing lawful units at $1,900 each, a $480,000 purchase and $45,000 of initial repairs. It produces $41,296 NOI on $539,400 total basis. Those are hypothetical inputs, not an available triplex, a rent comp or a financing offer.
Replace expenses with taxes after the proposed transaction, rental-use insurance, management, routine maintenance and actual owner-paid utilities. Fund known capital work and construction downtime separately. The downside tests lower rent, greater loss and higher operating costs together; a positive stabilized cash result is insufficient if the buyer cannot fund the transition.
Use the multifamily calculator for a fuller property case. The conversion comparison above answers how much another unit can justify; this acquisition lab answers whether the entire purchase can service its debt.
Buy collected income; make conversion upside earn its price
Acquire or hold an existing legal small building
Favor paid leases, a workable building budget and an offer that survives the competing rentals currently available. The reduced apartment pipeline supports investigation, with the urban Class C counterexample keeping rent assumptions disciplined.
Convert when approved incremental income clears the full cost
Require a defined permit path, priced work and realistic time to collections. Compare the total conversion cost, including any acquisition premium, with a hurdle based on incremental NOI. Revisit the decision when bids or accepted rents change that relationship.
Reprice or pass when the third unit is necessary to rescue the purchase
A seller cannot collect the capitalized value of future rent while leaving the buyer to pay every cost of creating it. If the existing leases fail the acquisition budget and the conversion has no funded margin, lower the offer or pass.
Continue with the metro investment overview and the Minnesota and Wisconsin rent guides for broader comparisons.
Questions before bidding on a Twin Cities conversion
Is the metro rent a reasonable new-unit quote?
It is a screening benchmark across homes and bedroom counts. Establish the proposed unit’s accepted rent using matched legal units and full lease charges.
Does a permitted unit already have income value?
A permit reduces one uncertainty. Construction cost, completion timing, financing and tenant acceptance still determine the income that can be created.
Can I apply the 6.5% hurdle to every property?
It is an assumed unlevered NOI hurdle in this example. Your required return, capital reserve, debt terms and project risk may justify a different threshold.
Sources and methodology
Evidence behind this report
- Northmarq Q2 2026 Minneapolis–St. Paul research, published September 4, retrieved October 22. Apartment survey coverage differs from the all-home provider market.
- Original PDF, pages 2–3: apartment supply, vacancy and rent segmentation. Exact underlying sample counts and weighting are not supplied. Forecasts are excluded from observed results.
- Federal Reserve Bank of Minneapolis, 2026 Minneapolis 2040 indicators: city permitting and development feasibility. City observations and interviews reported by the Fed, not interviews conducted by RentalCalcs. Permits are not completions or proof of zoning causation.
- Saint Paul Rules & Processes (2025), checked October 22, 2026: current construction exception, adjustment procedures and rent definitions. Applicability requires the actual property’s records.
- Minneapolis licensing and permit services, updated July 13, 2026: rental licenses and construction review. This report does not certify a conversion plan.
- Zillow all-home, all-bedroom, smoothed, seasonally adjusted metro ZORI CSV; observation 2026-09-30; retrieved 2026-10-20T07:45:10.471Z UTC
- Zillow repeat-rent methodology
- Census July 2023 metro delineations
- Zillow county-to-metro crosswalk, retrieved 2026-10-22
Geography and comparable populations
The official July 2023 metro has fifteen counties in Minnesota and Wisconsin. Zillow’s current county crosswalk includes those counties plus Sibley County, Minnesota. This headline follows the provider’s two-state market, not an independently reconstructed official CBSA. Official CBSA: 33460; separate Zillow RegionID: 394865. County and city figures are useful local checks but cannot reproduce this metro index.
| County | State | Zillow crosswalk |
|---|---|---|
| Anoka County | MN | Included |
| Carver County | MN | Included |
| Chisago County | MN | Included |
| Dakota County | MN | Included |
| Hennepin County | MN | Included |
| Isanti County | MN | Included |
| Le Sueur County | MN | Included |
| Mille Lacs County | MN | Included |
| Ramsey County | MN | Included |
| Scott County | MN | Included |
| Sherburne County | MN | Included |
| Washington County | MN | Included |
| Wright County | MN | Included |
| Pierce County | WI | Included |
| St. Croix County | WI | Included |
What the rent index measures
ZORI follows repeat asking-rent changes, weights toward the rental stock and smooths observations. It does not measure every signed lease, concessions, a two-bedroom quote, property income or a voucher payment standard. Broker apartment surveys have their own boundaries and property populations. Their vacancy and effective-rent readings are labeled by period and are never averaged into ZORI.
The headline and historical chart use one validated version. The file contains 740 metro rows; 740 have a latest-month observation. These are market counts, not rental-unit sample sizes; Zillow does not supply underlying unit sample counts here. Missing observations remain missing and prior months may be revised.
Refresh and editorial review
Provider Last-Modified: Fri, 16 Oct 2026 01:56:12 GMT. This page serves the stored published version. The shared weekly refresh publishes validated versions atomically and retains the previous version on failure. Changed interpretation is flagged for review; imports do not advance the editorial review date. Local broker studies and photographs retain their own dates.
This newly reviewed history comes from the committed download retrieved 2026-10-23T03:27:39.993Z; its complete source-file fingerprint, period and coverage match the stored publication. The next changed-source import stores all reviewed histories together.
SHA-256: cf1ac2ab12236da3e05a81d06542e6fb95581704c6e9f375424e73b72ccb444b
Investment judgments are RentalCalcs’ analysis of the stated evidence. Purchase examples are explicitly assumed underwriting cases, not listings, appraisals, financing quotes or observed market cap rates. Report a correction.