State rent research · editorial review 2026-10-24
Average Rent in South Carolina: ZIPs, Concessions & Rental Tax
The median of 121 tracked South Carolina ZIP rent indices is $1,682 per month for September 2026.
Equal weight per ZIP · all homes and bedrooms combined · derived from Zillow’s smoothed asking-rent indices; this ZIP series is not seasonally adjusted. This is not a provider-published statewide estimate, an average paid by tenants or a rent quote for a particular home.
Upstate incentives and Columbia’s delivery pipeline can limit collected income even where asking rents hold up. For a South Carolina home bought for rental use, copying a qualifying owner’s tax bill can compound that error: both the assessment ratio and school-operating treatment can differ.
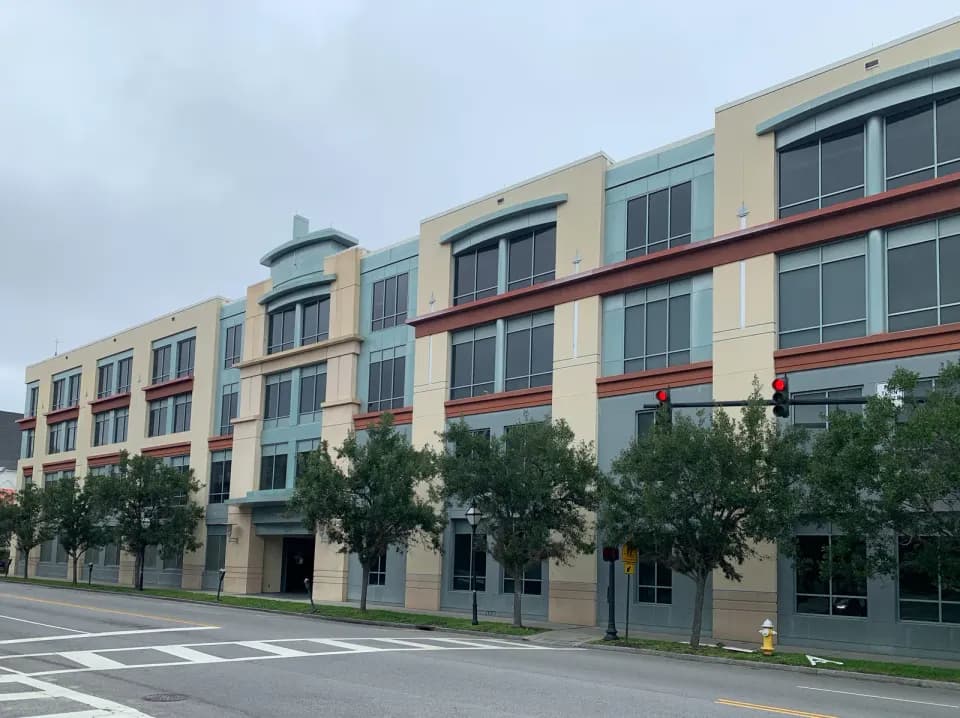
2020-06-15 · ProfReader · Original photograph · CC BY-SA 4.0. Resized and converted to WebP.

What the rent evidence changes for a rental decision
Compare signed leases after incentives, then rebuild the subject’s rental-use tax expense with its assessor and taxing districts. Demand evidence for a rent increase large enough to cover higher buyer costs; a statewide ZIP benchmark cannot supply it.
Greenville–Spartanburg apartments
A higher asking rent can conceal a larger incentive
Colliers reports first-half 2026 concessions averaging 4.6%, versus 3.75% a year earlier, in its Greenville–Spartanburg apartment research. Its September release lists only 90 units expected during the remainder of 2026. Expected deliveries are not completed homes, and the institutional apartment sample is different from the state ZIP indices.
A thinning pipeline supports investigating a better renewal outlook, but incentives are already reducing the first lease’s proceeds. An owner competing with those buildings should compare the whole lease, including free periods and included services, before treating a higher face rent as improvement.
Decision. Obtain signed competitor offers and the subject’s actual renewal/concession ledger. Use incentives on the occupied share in the worksheet. Investigate competing deliveries near the property rather than assuming the reported metro pipeline determines its vacancy.
What could change it. A scarce small house with no directly competing lease-up may collect its full quoted rent. Continued incentives, weak renewals or a delayed pipeline would weaken a recovery case; the 90-unit outlook is not a guaranteed supply constraint.
Records to obtain. Signed leases, concession addenda, receipts, renewal offers and dated completion/availability evidence for the actual competitive set.
Read the source reports
- Colliers Greenville–Spartanburg Q2 2026 — Published September 8, 2026; first-half concessions and Q2 apartment conditions; accessed October 24, 2026.
Columbia apartments
Government and university demand do not eliminate delivery competition
IRR’s August 2026 Columbia summary identifies state government, Fort Jackson, healthcare and USC as durable demand sources while warning of pipeline pressure in late 2026 and 2027. This is a regional apartment interpretation and forward outlook, not a verified rent increase for every university-area or military-oriented rental.
A longer tenancy and documented collections can be more valuable than an unsupported rent reset. A student per-bed contract, a conventional apartment and a furnished military-oriented home have different rent periods and services; they cannot become comparable merely by sharing a Columbia postal label.
Decision. Match unit type, lease term and services, then review the subject’s expiration schedule against actual nearby openings. Test no rent growth and an occupied-share free month before paying for forecast demand.
What could change it. An employer-linked renewal book or an underserved layout may withstand new supply. A concentrated lease-expiration month, a delayed incoming tenant or newer directly competing units can reverse that advantage.
Records to obtain. Unit/bed definition, executed lease calendar, renewal and collection history, included services and competing property delivery records.
Read the source reports
- IRR Columbia Mid-Year Viewpoint 2026 — August 2026 public multifamily summary; late-2026/2027 pipeline is an outlook, not completed supply; read October 24, 2026.

2013-01-20 (Exif) · Runner1928 · Original photograph · CC0. Resized and converted to WebP.

South Carolina rental-use property taxes
The seller’s legal-residence bill can omit two buyer costs
RFA distinguishes a 4% owner-occupied assessment ratio from 6% treatment for “Commercial and Rental Real Property.” Tax is value × assessment ratio × millage; 6% is not a tax rate applied directly to the price. The code also exempts qualifying owner-occupied property from school-operating tax, while retaining general-obligation debt millage.
Changing only 4% to 6% can still understate a full rental-use bill if the starting bill excluded school operations. The illustration holds value fixed to isolate both mechanisms. A real acquisition can also change valuation, exemptions, timing and credits.
Decision. Ask the assessor/auditor for the subject’s rental-use valuation, classification, complete millage and effective tax year. Reconcile the projected bill rather than multiplying a seller’s escrow payment by 1.5. Mixed owner/rental use requires its own eligibility and allocation review.
What could change it. A genuine qualifying legal residence or verified parcel relief changes the comparison. Actual local millage can be higher or lower than the assumed example; neither the photo nor the ZIP index establishes eligibility or a future bill.
Records to obtain. Parcel record, assessor/auditor projection, acquisition/use-change timing, all taxing districts, exemptions and full bill including school and debt components.
Read the source reports
- South Carolina RFA property-tax calculation and assessment ratios — Current primary guidance reviewed October 24, 2026; ratios are not effective tax rates.
- South Carolina Code 12-37-220(B)(47) — Current enacted school-operating exemption reviewed October 24, 2026; excludes general-obligation debt millage.
Hypothetical full-year comparison · fixed $300,000 taxable value · 100 other/debt mills plus 200 school-operating mills · no other relief, fees or valuation change · not a local tax quote
Same assumed value · $300,000
100 other/debt mills + 200 school-operating mills
Hatched · $3,600 school operations
- Ratio effect · +$6004% → 6% on the same other/debt millage
- School effect · +$3,600Rental case has no qualifying owner school-operating relief
Combined annual difference · $4,200
Assumed millages and fixed value isolate the mechanism. Actual value, districts, relief and effective year must be verified.
| Measure | Value | Definition |
|---|---|---|
| Qualifying owner case | 1,200 | $300,000 × 4% × 100/1,000 = $1,200; school-operating exemption assumed. |
| Ratio change on the other/debt portion | 600 | $1,800 rental other/debt tax less $1,200 owner case = $600. |
| Rental school-operating portion | 3,600 | $300,000 × 6% × 200/1,000 = $3,600; no qualifying owner exemption assumed. |
| Full rental case | 5,400 | $1,800 + $3,600 = $5,400 annual tax in this illustration. |
| Annual expense difference | 4,200 | $5,400 − $1,200 = $4,200, rather than a ratio-only $600 difference. |
The bridge isolates classification and school treatment, not an estimate of any county’s actual bill. The worksheet already includes the $5,400 rental case in annual expenses; do not add it again. Its $20 annual margin becomes a misleading $4,220 if the $1,200 owner case is substituted. Recovering that $4,200 difference requires about $369 more monthly rent after 5% loss, with all other assumptions unchanged—not evidence that tenants will pay it.
Read the source reports
- South Carolina RFA property-tax calculation and assessment ratios — Current primary guidance reviewed October 24, 2026; ratios are not effective tax rates.
- South Carolina Code 12-37-220(B)(47) — Current enacted school-operating exemption reviewed October 24, 2026; excludes general-obligation debt millage.
Compare rents across these county groups
These analyst-selected sets use the listed county labels and the same September 2026 observation month. Each ZIP receives one equal vote. They are not official metro definitions, exhaustive regions or bedroom comparisons.
25 distinct county labels appear in the current sample; geographic coverage is incomplete and uneven. Only currently available observations from the same latest month enter these comparisons. Older retained records and missing ZIPs do not enter as zero rents.
| Comparison and exact membership | ZIP median | ZIP count |
|---|---|---|
| Charleston-area county set Charleston, Berkeley, Dorchester | $1,906 | 21 |
| Greenville / Anderson / Pickens set Greenville, Anderson, Pickens | $1,502 | 23 |
| Spartanburg / Cherokee set Spartanburg, Cherokee | $1,575 | 13 |
| Columbia-area county set Richland, Lexington, Kershaw, Fairfield | $1,646 | 20 |
| Horry / Georgetown set Horry, Georgetown | $1,785 | 12 |
| Beaufort / Jasper set Beaufort, Jasper | $2,050 | 9 |
Compare supported postal-city groups
City links require at least three current ZIP observations. Postal city labels are not legal municipal boundaries. Groups are ordered by coverage, then name; this is not an affordability ranking.
12 matching cities
| Postal city | ZIP median / month | ZIP mean / month | ZIP count |
|---|---|---|---|
| Columbia | $1,517 | $1,561 | 10 |
| Charleston | $2,304 | $2,460 | 7 |
| Greenville | $1,572 | $1,591 | 7 |
| Spartanburg | $1,363 | $1,371 | 5 |
| Myrtle Beach | $1,669 | $1,659 | 4 |
| North Charleston | $1,761 | $1,802 | 4 |
| Anderson | $1,284 | $1,306 | 3 |
| Beaufort | $1,744 | $1,840 | 3 |
Show 4 more city groups
| Postal city | ZIP median / month | ZIP mean / month | ZIP count |
|---|---|---|---|
| Florence | $1,519 | $1,432 | 3 |
| Fort Mill | $1,756 | $1,757 | 3 |
| Summerville | $1,906 | $1,858 | 3 |
| Sumter | $1,546 | $1,543 | 3 |
Find a ZIP rent observation
The table preserves each source ZIP, date and supplied county label. A ZIP can cross county or municipal boundaries; verify the actual address separately. No bedroom multiplier is applied.
121 matching ZIPs
| ZIP | Postal city | County label | Index / month | Observation |
|---|---|---|---|---|
| 29016 | Blythewood | Richland County | $1,768 | September 2026 |
| 29033 | Cayce | Lexington County | $1,369 | September 2026 |
| 29036 | Chapin | Lexington County | $2,207 | September 2026 |
| 29040 | Dalzell | Sumter County | $1,619 | September 2026 |
| 29045 | Elgin | Kershaw County | $1,780 | September 2026 |
| 29063 | Irmo | Richland County | $1,753 | September 2026 |
| 29072 | Lexington | Lexington County | $1,724 | September 2026 |
| 29073 | Lexington | Lexington County | $1,850 | September 2026 |
| 29078 | Lugoff | Kershaw County | $1,675 | September 2026 |
| 29115 | Orangeburg | Orangeburg County | $911 | September 2026 |
Show 111 more ZIP observations
| ZIP | Postal city | County label | Index / month | Observation |
|---|---|---|---|---|
| 29150 | Sumter | Sumter County | $1,316 | September 2026 |
| 29153 | Sumter | Sumter County | $1,766 | September 2026 |
| 29154 | Sumter | Sumter County | $1,546 | September 2026 |
| 29169 | West Columbia | Lexington County | $1,562 | September 2026 |
| 29170 | Springdale | Lexington County | $1,423 | September 2026 |
| 29201 | Columbia | Richland County | $1,959 | September 2026 |
| 29203 | Columbia | Richland County | $1,385 | September 2026 |
| 29204 | Columbia | Richland County | $1,462 | September 2026 |
| 29205 | Columbia | Richland County | $1,745 | September 2026 |
| 29206 | Columbia | Richland County | $1,497 | September 2026 |
| 29209 | Columbia | Richland County | $1,537 | September 2026 |
| 29210 | Columbia | Richland County | $1,161 | September 2026 |
| 29212 | Columbia | Lexington County | $1,616 | September 2026 |
| 29223 | Columbia | Richland County | $1,464 | September 2026 |
| 29229 | Columbia | Richland County | $1,788 | September 2026 |
| 29301 | Spartanburg | Spartanburg County | $1,353 | September 2026 |
| 29302 | Spartanburg | Spartanburg County | $1,513 | September 2026 |
| 29303 | Spartanburg | Spartanburg County | $1,405 | September 2026 |
| 29306 | Spartanburg | Spartanburg County | $1,219 | September 2026 |
| 29307 | Spartanburg | Spartanburg County | $1,363 | September 2026 |
| 29316 | Boiling Springs | Spartanburg County | $1,597 | September 2026 |
| 29334 | Duncan | Spartanburg County | $1,812 | September 2026 |
| 29341 | Gaffney | Cherokee County | $980 | September 2026 |
| 29349 | Inman | Spartanburg County | $1,575 | September 2026 |
| 29360 | Laurens | Laurens County | $1,085 | September 2026 |
| 29365 | Lyman | Spartanburg County | $1,652 | September 2026 |
| 29369 | Moore | Spartanburg County | $1,739 | September 2026 |
| 29388 | Woodruff | Spartanburg County | $1,619 | September 2026 |
| 29401 | Charleston | Charleston County | $3,776 | September 2026 |
| 29403 | Charleston | Charleston County | $2,751 | September 2026 |
| 29405 | North Charleston | Charleston County | $2,076 | September 2026 |
| 29406 | North Charleston | Charleston County | $1,609 | September 2026 |
| 29407 | Charleston | Charleston County | $1,752 | September 2026 |
| 29410 | Hanahan | Berkeley County | $1,696 | September 2026 |
| 29412 | Charleston | Charleston County | $2,543 | September 2026 |
| 29414 | Charleston | Charleston County | $1,885 | September 2026 |
| 29418 | North Charleston | Charleston County | $1,787 | September 2026 |
| 29420 | North Charleston | Dorchester County | $1,735 | September 2026 |
| 29445 | Goose Creek | Berkeley County | $1,876 | September 2026 |
| 29455 | Charleston | Charleston County | $2,304 | September 2026 |
| 29456 | Ladson | Charleston County | $1,668 | September 2026 |
| 29461 | Moncks Corner | Berkeley County | $2,195 | September 2026 |
| 29464 | Mount Pleasant | Charleston County | $2,401 | September 2026 |
| 29466 | Mount Pleasant | Charleston County | $2,593 | September 2026 |
| 29472 | Ridgeville | Dorchester County | $1,705 | September 2026 |
| 29483 | Summerville | Dorchester County | $1,906 | September 2026 |
| 29485 | Summerville | Dorchester County | $1,733 | September 2026 |
| 29486 | Summerville | Berkeley County | $1,935 | September 2026 |
| 29492 | Charleston | Berkeley County | $2,206 | September 2026 |
| 29501 | Florence | Florence County | $1,730 | September 2026 |
| 29505 | Florence | Florence County | $1,519 | September 2026 |
| 29506 | Florence | Florence County | $1,048 | September 2026 |
| 29526 | Conway | Horry County | $1,809 | September 2026 |
| 29527 | Conway | Horry County | $1,800 | September 2026 |
| 29566 | Little River | Horry County | $1,562 | September 2026 |
| 29568 | Longs | Horry County | $1,840 | September 2026 |
| 29572 | Myrtle Beach | Horry County | $1,528 | September 2026 |
| 29575 | Surfside Beach | Horry County | $1,612 | September 2026 |
| 29576 | Murrells Inlet | Horry County | $1,919 | September 2026 |
| 29577 | Myrtle Beach | Horry County | $1,682 | September 2026 |
| 29579 | Myrtle Beach | Horry County | $1,769 | September 2026 |
| 29582 | North Myrtle Beach | Horry County | $1,949 | September 2026 |
| 29585 | Pawleys Island | Georgetown County | $1,841 | September 2026 |
| 29588 | Myrtle Beach | Horry County | $1,656 | September 2026 |
| 29601 | Greenville | Greenville County | $1,825 | September 2026 |
| 29605 | Greenville | Greenville County | $1,718 | September 2026 |
| 29607 | Greenville | Greenville County | $1,501 | September 2026 |
| 29609 | Greenville | Greenville County | $1,538 | September 2026 |
| 29611 | Greenville | Greenville County | $1,590 | September 2026 |
| 29615 | Greenville | Greenville County | $1,393 | September 2026 |
| 29617 | Greenville | Greenville County | $1,572 | September 2026 |
| 29621 | Anderson | Anderson County | $1,381 | September 2026 |
| 29624 | Anderson | Anderson County | $1,284 | September 2026 |
| 29625 | Anderson | Anderson County | $1,253 | September 2026 |
| 29630 | Central | Pickens County | $1,288 | September 2026 |
| 29631 | Clemson | Pickens County | $1,338 | September 2026 |
| 29640 | Easley | Pickens County | $1,501 | September 2026 |
| 29642 | Easley | Pickens County | $1,927 | September 2026 |
| 29644 | Fountain Inn | Greenville County | $2,105 | September 2026 |
| 29646 | Greenwood | Greenwood County | $847 | September 2026 |
| 29649 | Greenwood | Greenwood County | $1,225 | September 2026 |
| 29650 | Greer | Greenville County | $1,698 | September 2026 |
| 29651 | Greer | Spartanburg County | $1,614 | September 2026 |
| 29662 | Mauldin | Greenville County | $1,381 | September 2026 |
| 29670 | Pendleton | Anderson County | $1,502 | September 2026 |
| 29673 | Piedmont | Greenville County | $1,455 | September 2026 |
| 29678 | Seneca | Oconee County | $1,394 | September 2026 |
| 29680 | Simpsonville | Greenville County | $1,771 | September 2026 |
| 29681 | Simpsonville | Greenville County | $1,884 | September 2026 |
| 29687 | Taylors | Greenville County | $1,380 | September 2026 |
| 29690 | Travelers Rest | Greenville County | $1,787 | September 2026 |
| 29707 | Fort Mill | Lancaster County | $1,739 | September 2026 |
| 29708 | Fort Mill | York County | $1,777 | September 2026 |
| 29710 | Clover | York County | $2,002 | September 2026 |
| 29715 | Fort Mill | York County | $1,756 | September 2026 |
| 29720 | Lancaster | Lancaster County | $1,431 | September 2026 |
| 29730 | Rock Hill | York County | $1,536 | September 2026 |
| 29732 | Rock Hill | York County | $1,489 | September 2026 |
| 29801 | Aiken | Aiken County | $1,492 | September 2026 |
| 29803 | Aiken | Aiken County | $1,251 | September 2026 |
| 29841 | North Augusta | Aiken County | $1,478 | September 2026 |
| 29860 | North Augusta | Edgefield County | $1,904 | September 2026 |
| 29902 | Beaufort | Beaufort County | $1,726 | September 2026 |
| 29906 | Beaufort | Beaufort County | $1,744 | September 2026 |
| 29907 | Beaufort | Beaufort County | $2,050 | September 2026 |
| 29909 | Bluffton | Beaufort County | $2,715 | September 2026 |
| 29910 | Bluffton | Beaufort County | $1,986 | September 2026 |
| 29926 | Hilton Head Island | Beaufort County | $2,553 | September 2026 |
| 29927 | Hardeeville | Jasper County | $2,093 | September 2026 |
| 29928 | Hilton Head Island | Beaufort County | $2,933 | September 2026 |
| 29936 | Ridgeland | Jasper County | $1,676 | September 2026 |
Does the rental-use bill leave enough collected income?
Hypothetical home: $1,800 rent, 5% loss, no free month, $10,000 operating costs ($5,400 illustrative rental tax plus $4,600 other costs), $9,500 debt and $1,000 replacement reserve. These are assumptions, not a South Carolina property quote. Acquisition cash, initial work and income taxes are separate.
Initial calculated result: $20,520 collected rent, $10,520 NOI before debt/reserves, and $20 cash after debt/reserves. Change the assumptions below to test your own budget.
Illustration · one apartment · first 12 months · USD. Editable assumptions, not observed market averages or an acquisition recommendation. All recurring amounts are allocated per apartment. No appreciation, sale proceeds or tax benefits are assumed.
Annual cash after operating costs, debt and reserve contribution
$20This is a positive illustration margin, before initial capital work, income tax and sale costs.
- Scheduled rent
- $21,600
- − Vacancy / noncollection
- -$1,080
- − Occupied-share concession
- -$0
- = Effective rental income
- $20,520
- − Operating expenses
- -$10,000
- = NOI before debt / reserves
- $10,520
- − Debt service
- -$9,500
- − Reserve contribution
- -$1,000
- = Annual cash margin
- $20
NOI excludes debt service and this worksheet’s reserve contribution. Initial renovation, acquisition costs and initial downtime are outside this annual operating illustration. Do not subtract the same vacancy, incentive or repair expense twice.
On a narrow screen, scroll the table sideways to compare all three expense budgets.
| Collected occupancy | Entered expenses | Expenses +10% | Expenses +20% |
|---|---|---|---|
| 95% | $20Cash remaining | -$980Cash deficit | -$1,980Cash deficit |
| 90% | -$1,060Cash deficit | -$2,060Cash deficit | -$3,060Cash deficit |
| 85% | -$2,140Cash deficit | -$3,140Cash deficit | -$4,140Cash deficit |
Occupancy here is the collected share of scheduled rent before incentives, not a count of occupied doors. At the entered costs, break-even collected occupancy is 94.9%. Debt-service coverage is 1.11× NOI / debt service; it excludes reserve contributions.
Reference annual cash is $20. One additional occupied-share month without rent removes $1,710 and leaves −$1,690. Just $20 more annual operating cost eliminates the reference margin. Verify the actual bill and matched rent before treating this as an income investment; a rent increase is not an automatic remedy.
Use the full property cash-flow calculator for the purchase price, financing terms and holding period. Review its expense and reserve conventions before transferring assumptions; this illustration does not automatically populate a deal.
South Carolina rent questions
Is this South Carolina’s one-bedroom average rent?
No. It is an equal-weight median of same-month all-home/all-bedroom ZIP asking-rent indices, smoothed and not seasonally adjusted. It is not a household-weighted average, a bedroom estimate or a provider-published statewide ZORI.
Is a 6% rental assessment a 6% property-tax bill?
No. The assessment ratio is one factor in value × ratio × millage. Check the actual value, districts, credits and effective year. The worked example uses assumed millages and is not a county quote.
Can I budget the seller’s owner-occupied taxes for a rental?
Obtain a rental-use projection first. Classification, school-operating treatment, valuation and timing can differ. A mixed-use or qualifying owner case requires individual review.
Do fewer expected Upstate deliveries guarantee rent growth?
No. Check actual completions, renewals and incentives in the subject’s competitive set. The reported pipeline is a dated outlook; the worksheet’s rent and loss inputs remain assumptions.
How these rent figures are calculated
State: South Carolina · USPS SC · Census state FIPS 45. Zillow supplies postal ZIP observations with city and county labels. We filter to valid positive rents in this state and the latest common observation month, sort the values, and take the middle value, or the mean of the two middle values for an even count. Means are the sum divided by included ZIPs. No population, household or rental-unit weighting is added.
The all-home, all-bedroom ZIP series is smoothed, not seasonally adjusted. A bedroom rent cannot be inferred from it. Membership can change after a refresh, so a change in this page’s median is not a matched-sample rent-growth rate. This edition does not publish a ZIP-sample growth claim.
Data: Zillow Research · ZORI method · National ZIP source CSV. The state benchmark is our ZIP-based calculation, not a provider-published statewide estimate. Occupied-unit Census rent, listing medians, effective broker rents and HUD gross-rent references answer different questions and are not blended here.
The observation month identifies the rent data available for this comparison. Historical or missing latest observations stay out of the current sample. Check the date before comparing a property with a newly advertised offer.
Market and legal sources below were reviewed 2026-10-24. Their own periods are shown next to each claim. Broker samples and boundaries are not fully disclosed; surveys may share underlying providers and should not be treated as independent experiments. The market interpretation is conditional research, not a property-level income guarantee. Recheck local rules, signed comparable leases and actual expenses before using an illustration in a transaction.
Read the source reports
- Colliers Greenville–Spartanburg Q2 2026 — Published September 8, 2026; first-half concessions and Q2 apartment conditions; accessed October 24, 2026.
- IRR Columbia Mid-Year Viewpoint 2026 — August 2026 public multifamily summary; late-2026/2027 pipeline is an outlook, not completed supply; read October 24, 2026.
- South Carolina RFA property-tax calculation and assessment ratios — Current primary guidance reviewed October 24, 2026; ratios are not effective tax rates.
- South Carolina Code 12-37-220(B)(47) — Current enacted school-operating exemption reviewed October 24, 2026; excludes general-obligation debt millage.