New York apartment cap-rate evidence
Ariel Property Advisors reports H1 2026 average caps of 6.07% in Manhattan, 6.83% in Queens, 7.06% in Brooklyn and 8.55% in the Bronx for multifamily transactions with 10 or more residential units. These are changing sale cohorts with different regulated-unit exposure, not a New York statewide average or a price for a particular neighborhood.
Cap rate is annual net operating income (NOI) divided by price, before financing. The right comparison starts with the property type, legal income, observation period and source method. There is no defensible statewide average in this edition.
| Geography / source | Cap / comparison | Period / statistic | Coverage boundary |
|---|---|---|---|
| Manhattan Ariel Property Advisors — Manhattan H1 2026 | 6.07% -10 bps vs 6.17% | H1 2026 vs full-year 2025 Published average; 10+ residential units | Institutional/free-market mix; includes projected closings. |
| Queens Ariel Property Advisors — Queens H1 2026 | 6.83% +6 bps vs 6.77% | H1 2026 vs full-year 2025 Published average; 10+ residential units | Regulated and free-market assets blended. |
| Brooklyn Ariel Property Advisors — Brooklyn H1 2026 | 7.06% +10 bps vs 6.96% | H1 2026 vs full-year 2025 Published average; 10+ residential units | Distress and portfolio composition affect the cohort. |
| Bronx Ariel Property Advisors — Bronx H1 2026 | 8.55% +31 bps vs 8.24% | H1 2026 vs full-year 2025 Published average; 10+ residential units | Substantial regulated exposure; not Riverdale pricing. |
Ariel’s borough reports incorporate projected closings and combine different rent-regulation mixes. The 2025 comparator is a full-year cohort, not H1 2025: the changes below are period comparisons, not year-over-year changes. Cap-reporting sample size, NOI convention and weighting are undisclosed. Northern Manhattan is excluded because its HTML narrative says 8.70% while its table says 8.30%; neither is silently chosen. Manhattan is Ariel’s report geography and must not be assumed to include that separately reported district. One percentage point equals 100 basis points. No incompatible series are averaged.
The underwriting implication: A high reported cap can coexist with a shrinking legal income stream. In New York, establish lawful collectible rents, buyer expenses and financing capacity before deciding whether a discount compensates for risk.
What the evidence changes locally
| Geography / period | Measure / value | Basis and limits |
|---|---|---|
| Manhattan 2023→2024 | Nominal average NOI change +9.8% | RGB RPIE buildings containing stabilized units; not the 2026 sale cohort NYC RGB — 2026 Income and Expense Study |
| Brooklyn 2023→2024 | Nominal average NOI change +4.4% | Same RGB RPIE series; not a forecast NYC RGB — 2026 Income and Expense Study |
| Queens 2023→2024 | Nominal average NOI change +6.8% | Same RGB RPIE series; not a neighborhood cap NYC RGB — 2026 Income and Expense Study |
| Bronx 2023→2024 | Nominal average NOI change −0.1% | Borough average, not every building NYC RGB — 2026 Income and Expense Study |
| NYC stabilized-containing buildings April 2025–March 2026 | Owner operating-cost price index +5.3% | Weighted market basket, not each property’s realized expense change; fuel +11.0%, insurance +10.5% NYC RGB — 2026 Price Index of Operating Costs |
The official RGB evidence adds a counterweight to broad distress claims: nominal average NOI rose in three of these four boroughs in 2024, while the Bronx was nearly flat. These older operating filings do not measure 2026 sale NOI or prove that regulated buildings now have growing margins. The 2026 owner-cost index is a weighted price basket, not an increase to apply mechanically to every bill.
Manhattan: durable rents do not make every financing structure comparable
Observed evidence. Ariel’s H1 report records $2.34 billion of multifamily volume and a 6.07% average cap for the 10+-unit pricing cohort. Its featured Upper West Side portfolio interest transferred with 2.6% financing through 2031. That is transaction structure, not a current mortgage quote.
An assumable low-cost liability can increase what a buyer can pay for the same income. A newly originated loan does not reproduce that advantage. Separate fee-simple value, partial-interest consideration and the value of favorable debt before using the transaction as a comp.
RentalCalcs interpretation. Selective compression is plausible where documented free-market collections grow and competing capital accepts a lower yield. It is harder to support for a buyer who must refinance immediately: improved rent alone may not offset a higher mortgage constant.
What would change the view. A richer institutional sale mix can lower an average without repricing the same buildings. Weak renewals, concessions hidden behind headline rents or an expiring tax benefit would undermine the durability case.
Before an offer: Ask the broker for matched sales with financing terms, ownership interest, legal rent status and trailing NOI. Underwrite your actual debt separately; exclude any assumed benefit you cannot transfer.
Evidence: Ariel Property Advisors — Manhattan H1 2026 · Ariel — Q2 2026 Multifamily Quarter in Review
Brooklyn: a brownstone, regulated elevator building and affordable portfolio are different investments
Observed evidence. Ariel’s 10+-unit average moved from 6.96% in 2025 to 7.06% in H1 2026. Its Flatbush Pinnacle portfolio example comprised 2,692 regulated units sold in bankruptcy for $212.9 million. Matthews separately reports a 92-bp average free-market cap discount to stabilized product in its H1 Brooklyn sample; it is not a matched-pair adjustment.
Legal rent status changes the cash-flow remedy. A vacant apartment is not automatically available for a market-rent reset, and a discount that assumes otherwise can disappear once compliance and rehabilitation costs are recognized. Contract-affordable buildings require their own subsidy and tax-benefit review.
RentalCalcs interpretation. The useful base case is segmentation: transit-oriented free-market income can remain competitive while deeply regulated portfolios need a lower basis. A borough average cannot resolve which path applies to a specific block.
What would change the view. Distressed bulk sales can distort averages. Evidence of durable collections, funded repairs and a workable lender extension would weaken a forced-sale thesis; additional recapitalizations would strengthen it.
Before an offer: Reconcile each apartment’s registration, lease, preferential rent and actual receipts. Separate commercial income in mixed-use property. Compare renovation cost with legally achievable revenue, not an unrestricted asking-rent comp.
Evidence: Ariel Property Advisors — Brooklyn H1 2026 · Matthews — Brooklyn H1 2026 · NYC Rent Guidelines Board — Order 58

Queens: rising price per unit can conceal weaker pricing per square foot
Observed evidence. Ariel reports a 6.83% cap in H1 2026 versus 6.77% in 2025. Price per unit rose to approximately $230,000 while price per square foot fell to $231; the publisher attributes the divergence to larger-unit, lower-density product. These are cohort changes, not repeat-sale appreciation.
A larger apartment can sell for more per door and less per square foot at the same time. The rent roll must explain the unit mix, regulated exposure and operating burden. A Sunnyside walk-up cannot be priced by averaging a newer tower with a distressed portfolio.
RentalCalcs interpretation. Stable-to-wider caps remain a defensible stress for regulated income until sale comps demonstrate that financing and recurring expenses have stopped deteriorating. Free-market growth can improve NOI without proving a borough-wide yield reset.
What would change the view. A different building-size mix next half could reverse both price measures. Stronger collections and genuinely comparable closed sales at tighter yields would weaken the wider-cap case.
Before an offer: Normalize comp size and unit mix, then compare dollars of sustainable NOI per door and per square foot. Require the legal basis for every proposed turnover increase; do not attach a borough cap to Astoria or Ridgewood without matching evidence.
Evidence: Ariel Property Advisors — Queens H1 2026 · NYS HCR — Good Cause Eviction
The Bronx: a high nominal yield is a claim on future collectibility
Observed evidence. Ariel’s 10+-unit cap rose to 8.55% from 8.24% in 2025. Its report also highlights a $64 million, 127-unit Riverdale sale, illustrating that a regulated-heavy borough cohort does not describe every local asset.
A building with capped revenue and necessary heating, insurance or compliance spending has limited margin for error. Price per unit can look cheap while replacement work consumes the initial equity. Riverdale’s featured free-market transaction belongs in a separate comparison from distressed stabilized stock.
RentalCalcs interpretation. Further expansion is possible when refinancing proceeds cannot retire the existing loan and buyers need additional cash for work. Stabilization requires an executable capital plan and evidence of collections; a low acquisition basis alone cannot restore NOI.
What would change the view. A lender workout, committed rehabilitation capital or stronger actual receipts can reduce forced-sale pressure. Conversely, vacant units that cannot economically return to service would invalidate an optimistic occupancy assumption.
Before an offer: Request arrears aging, legal-rent history, violations, heating and elevator capital scopes, and lender terms. Calculate cash needed to fund the building after closing before treating the reported cap as spendable yield.
Evidence: Ariel Property Advisors — Bronx H1 2026 · NYC Rent Guidelines Board — Order 58
Secondary markets, submarkets and the boundary of the data
Neighborhood cap rates need neighborhood sales with a documented NOI basis. Metro operating conditions can guide a property investigation; they cannot manufacture a local cap. These gaps matter when selecting comparable sales and budgeting liquidity.
| Market | Available evidence | What is missing | Next underwriting action |
|---|---|---|---|
| Northern Manhattan | Ariel H1 2026 local narrative and table disagree: 8.70% versus 8.30%. | No resolved single figure; no quantitative cap plotted. | Obtain corrected source and actual regulated/free-market comparable sales before choosing a cap. |
| Long Island / Westchester / Hudson Valley | State regulation and municipal adoption must be checked separately from NYC. | No verified matching 2026 closed-sale cap sample in this edition. | Check town assessment, sewer/water charges, flood exposure, rent-law jurisdiction and buyer pool; NYC borough rates do not transfer. |
| Buffalo / Rochester | NY assessment guidance establishes local valuation systems; it does not supply market cap evidence. | No verified comparable apartment cap cohort or neighborhood NOI series included. | Obtain heat and water bills, collection history, roof scope and local 5+-unit sales. A small-house rent/value ratio is not an apartment cap. |
| Albany / Syracuse / secondary and rural markets | No new local cap series is asserted. | Employment announcements and construction proposals do not establish occupied units or current rent growth. | Test tenant employer concentration and actual project delivery dates. Compare student leases by academic cycle and retain a longer sale-marketing stress where liquidity is unproven. |

County tools answer a different screening question. County housing context and rent-to-value models are not matched-property NOI caps: Manhattan county screening · Kings County screening · Queens County screening · Bronx County screening.
Compression, stabilization or expansion?
Reported evidence: Ariel’s borough series shows Manhattan slightly tighter and the other three boroughs wider than their full-year 2025 cohorts. The data support divergence, not a statewide direction. Its proprietary database is one evidence family; four borough publications are not four independent confirmations.
Publisher perspective: Ariel’s Q2 commentary expects continued demand for free-market product alongside refinancing pressure in regulated stock. Matthews’ Brooklyn work also identifies a free-market premium, but its sample and mixed-use classifications differ. Its underlying data lineage is not fully disclosed, so we do not claim statistical independence.
Financing counterweight: CBRE’s June professional survey found roughly 60% of responses expected unchanged caps over the next six months, with greater dispersion and Class C expansion concerns. This is national professional sentiment, not a New York sale sample or a measured probability for your exit.
RentalCalcs interpretation: use segmented stabilization as the working case, and require evidence before underwriting compression. Test legal income growth and buyer expense inflation separately from the exit yield. Better leasing can raise value at a flat cap; it does not require the cap itself to fall.
Compression
Verified free-market NOI gains and more competitive executable debt attract buyers at a lower yield.
Watch: Matched unencumbered sales; collected renewals; lender spread and proceeds.
Invalidated or weakened by: Tighter cohort averages caused only by favorable assumable debt or trophy assets, or rising concessions.
Underwrite: Keep a flat-cap acquisition case; treat a tighter exit as upside after transaction and income evidence.
Stabilization — working case
Lower entry bases balance capped revenue, recurring costs and financing requirements; segments clear at different yields.
Watch: Sale withdrawals, actual collections, expense renewals and cash-in refinancing requirements.
Invalidated or weakened by: Persistently shrinking NOI or a broad move in comparable financing and sale yields.
Underwrite: Hold the exit cap flat in the reference case, stress income and fund known capital work separately.
Expansion
Refinancing shortfalls and cost growth force regulated sellers to accept lower prices for sustainable income.
Watch: Loan maturity dates, binding insurance quotes, violations, arrears and verified distressed sales.
Invalidated or weakened by: Funded workouts, stable collections and comparable arm’s-length sales clearing without concessions.
Underwrite: Test a wider cap and lower NOI together. Increase liquidity; do not finance the plan with assumed rent deregulation.
These are conditional editorial cases, not probabilities or publisher basis-point forecasts. A lower short-term policy rate does not guarantee a cheaper property loan: the Treasury curve, lender spread, amortization and proceeds all matter. Cap spreads alone do not measure total risk.
Separate the income decision from the cap-rate decision
Value = annual NOI ÷ (cap rate ÷ 100). At $150,000 NOI and a 6.00% cap, value is $2,500,000. Widening the cap by 100 basis points to 7.00%, with NOI unchanged, changes gross value by -14.3%. A one-point cap move is not a one-percent price move.
- Classify the rent rollSeparate stabilized, free-market, contract-affordable and retail income; verify legal rents and benefits.
- Rebuild buyer NOIUse collected revenue less recurring buyer taxes, insurance and operations; keep capital work below NOI.
- Match the sale evidenceMatch regulation, unit count, location, NOI convention and financing. Reject a comp whose income basis cannot be explained.
- Price the downside and cash needStress cost inflation and a wider exit together; size debt and capital liquidity before deciding the offer.
Original underwriting sequence for New York. Choose an exit yield independently of the income growth needed to justify the deal.
| Cumulative NOI change | 5.00% exit cap | 6.00% exit cap | 7.00% exit cap | 8.00% exit cap |
|---|---|---|---|---|
| -10% total | +8.0% | -10.0% | -22.9% | -32.5% |
| 0% total | +20.0% | 0.0% | -14.3% | -25.0% |
| +10% total | +32.0% | +10.0% | -5.7% | -17.5% |
| +20% total | +44.0% | +20.0% | +2.9% | -10.0% |
Original calculations. This reference table does not change with the tool. NOI growth is cumulative, not annual. Simple property values exclude debt payoff, sale costs, income/capital-gains taxes and interim cash flows; they are not total investment returns.
One acquisition, one reconciled buyer budget
This hypothetical 20-unit purchase illustrates the report’s decision process; it is not a listing, appraisal or local cost quote. Replace each assumption with property evidence. Every line below belongs to the same acquisition.
| Budget line | Annual amount | Basis |
|---|---|---|
| Scheduled income | $384,000 | 20 units × $1,600 monthly × 12 |
| Vacancy, concessions and collection loss | −$38,400 | 10.0% of scheduled; one combined deduction |
| Effective collected income | $345,600 | Scheduled less combined loss |
| Buyer property taxes | $65,000 | Illustrative buyer expense; verify actual evidence |
| Insurance | $24,000 | Illustrative buyer expense; verify actual evidence |
| Management | $18,000 | Illustrative buyer expense; verify actual evidence |
| Recurring repairs | $30,000 | Illustrative buyer expense; verify actual evidence |
| Owner utilities | $40,000 | Illustrative buyer expense; verify actual evidence |
| Administration and recurring compliance | $18,600 | Illustrative buyer expense; verify actual evidence |
| Recurring expense total | $195,600 | Sum of six operating rows |
| NOI / going-in cap | $150,000 / 6.00% | Before debt, replacement reserve and income tax |
NYC property tax is an income-property calculation
NYC Class 2 guidance uses a 45% assessment percentage and actual/transitional assessment rules; 45% is not a tax rate. Reconcile the Notice of Property Value, billable assessment, exemptions and benefit expiration with the buyer budget. Outside NYC, use the actual municipality’s assessment level and complete taxing-district bill. A sale price is not a universal automatic reset rule. NYC Department of Finance — Class 2 guide.
Renewal permission is not market rent growth
NYC Order 58 sets 0% one- and two-year adjustments for covered apartment leases beginning October 1, 2026 through September 30, 2027, subject to the order’s scope and other lawful adjustments. Do not apply it to every New York apartment. Separately verify Good Cause applicability and exemptions with HCR guidance, local adoption and counsel. NYC Rent Guidelines Board — Order 58.
Insurance and capital reserves need different evidence
DFS commercial-property guidance distinguishes coverage forms and flood protection. Get building-specific replacement cost, water/flood, equipment-breakdown, liability and interruption terms. Inspect roof, masonry, heat and elevator work. An annual premium placeholder is not a quote, and a reserve is not a recurring repair invoice. NY DFS — Information for small businesses.
| Measure | Amount / treatment |
|---|---|
| Loan / interest / amortization | $1,375,000 / 6.5% / 30 years |
| Annual debt service | $104,291 |
| Replacement reserve below NOI | $12,000 per year |
| Invested cash | $1,375,000 = $1,125,000 down + $90,000 closing + $160,000 immediate capital work |
| Cash after debt and reserve | $33,709; cash-on-cash 2.45%, before income tax |
| DSCR / debt yield before reserves | 1.44× / 10.91% |
| DSCR after replacement reserve | 1.32×; confirm lender convention |
The mortgage constant is 7.58%. Lender sizing may be limited by coverage, leverage, debt yield or reserve-adjusted NOI. A hypothetical 1.25× coverage requirement before reserves would allow $120,000 annual debt service; this is a sizing illustration, not a universal lender rule. Yield on total acquisition cost, using current NOI and price plus closing and immediate work, is 5.45%. It differs from the going-in cap; future stabilized yield on cost would need a separate earned NOI and all carrying/rehabilitation costs.
Core report analysis is free. Enter your assumptions again in the linked calculator; they do not transfer automatically. A tool click is separate from a completed calculation or saved analysis.
Before relying on New York cap-rate evidence
What is a good New York cap rate?
A defensible rate compensates for the specific income and capital risks after normalizing NOI. The borough averages do not set a buy threshold. An 8% nominal cap on an uncollectible or capital-starved rent roll can be less attractive than a lower cap on durable income.
Can I apply these numbers to upstate duplexes?
No. This comparison is 10+-unit NYC apartment pricing. Duplexes may have different financing, owner-occupant competition and expense structures. Upstate markets require local sale evidence; missing data are not zero risk.
What would make this report insufficient for an offer?
Missing legal rent records, trailing collections, binding insurance, buyer taxes, engineering scope or matched closed-sale NOI. The report supplies a research framework and transparent stress analysis; those property documents determine the offer.
Keep the evidence with the offer
Record the comp basis, buyer budget, debt sizing, capital work and the fact that would change your thesis.
Open the free printable New York worksheetCheck what belongs in NOI · Compare California’s separately researched report · New York county directory
Sources, lineage and refresh policy
Accessed and substantively reviewed October 18, 2026. Each observation retains its actual period. Public summaries often omit cap-reporting sample size, NOI convention and weighting; no missing field is inferred. Brokerages have commercial advisory interests. Publications sharing CoStar, RCA/MSCI or one proprietary database do not establish independent corroboration.
Read the full source ledger, methods and refresh triggers
- NYC RGB — 2026 Income and Expense Study
Observation / applicability: 2023–2024 comparable operating data. Publication: March 26, 2026. Access and review: October 18, 2026.
Underlying provider: NYC Department of Finance RPIE filings; RGB analysis Geography / asset: NYC buildings containing stabilized units; not Ariel sale cohorts
Statistic, NOI, sample, weighting and limits: Nominal average NOI change by borough; different sample and period from cap evidence. Not a 2026 realized NOI forecast; adjusted/unadjusted measures remain distinct.
Refresh trigger: 2027 study or source correction.
- NYC RGB — 2026 Price Index of Operating Costs
Observation / applicability: April 2025–March 2026. Publication: April 9, 2026. Access and review: October 18, 2026.
Underlying provider: RGB weighted owner market-basket research Geography / asset: NYC buildings containing stabilized apartments
Statistic, NOI, sample, weighting and limits: Weighted cost price index, not each building actual bill or statewide expense inflation. Forecasts separate from measured index.
Refresh trigger: Next annual index or property quotes.
- Ariel Property Advisors — Manhattan H1 2026
Observation / applicability: H1 2026 pricing; full-year 2025 comparator. Publication: July 2026. Access and review: October 18, 2026.
Underlying provider: Ariel proprietary transaction database; related borough reports share this source family. Geography / asset: Publisher-defined Manhattan market; pricing metrics for multifamily transactions of 10+ residential units.
Statistic, NOI, sample, weighting and limits: Published average cap. Includes projected closings. NOI convention, cap sample count and weighting undisclosed. All multifamily transaction totals are broader than the cap cohort. PDF printed page 8 / physical page 5 visually checked; summary only, report not reproduced.
Refresh trigger: H2 edition, final-closing revision or methodology correction.
- Ariel Property Advisors — Brooklyn H1 2026
Observation / applicability: H1 2026 pricing; full-year 2025 comparator. Publication: July 2026. Access and review: October 18, 2026.
Underlying provider: Ariel proprietary transaction database; related borough reports share this source family. Geography / asset: Publisher-defined Brooklyn market; pricing metrics for multifamily transactions of 10+ residential units.
Statistic, NOI, sample, weighting and limits: Published average cap. Includes projected closings. NOI convention, cap sample count and weighting undisclosed. All multifamily transaction totals are broader than the cap cohort. PDF printed page 8 / physical page 5 visually checked; summary only, report not reproduced.
Refresh trigger: H2 edition, final-closing revision or methodology correction.
- Ariel Property Advisors — Queens H1 2026
Observation / applicability: H1 2026 pricing; full-year 2025 comparator. Publication: July 2026. Access and review: October 18, 2026.
Underlying provider: Ariel proprietary transaction database; related borough reports share this source family. Geography / asset: Publisher-defined Queens market; pricing metrics for multifamily transactions of 10+ residential units.
Statistic, NOI, sample, weighting and limits: Published average cap. Includes projected closings. NOI convention, cap sample count and weighting undisclosed. All multifamily transaction totals are broader than the cap cohort. PDF printed page 8 / physical page 5 visually checked; summary only, report not reproduced.
Refresh trigger: H2 edition, final-closing revision or methodology correction.
- Ariel Property Advisors — Bronx H1 2026
Observation / applicability: H1 2026 pricing; full-year 2025 comparator. Publication: July 2026. Access and review: October 18, 2026.
Underlying provider: Ariel proprietary transaction database; related borough reports share this source family. Geography / asset: Publisher-defined Bronx market; pricing metrics for multifamily transactions of 10+ residential units.
Statistic, NOI, sample, weighting and limits: Published average cap. Includes projected closings. NOI convention, cap sample count and weighting undisclosed. All multifamily transaction totals are broader than the cap cohort. PDF printed page 8 / physical page 5 visually checked; summary only, report not reproduced.
Refresh trigger: H2 edition, final-closing revision or methodology correction.
- Ariel — Northern Manhattan H1 2026
Observation / applicability: H1 2026. Publication: July 2026. Access and review: October 18, 2026.
Underlying provider: Ariel proprietary data Geography / asset: Northern Manhattan 10+-unit multifamily
Statistic, NOI, sample, weighting and limits: Narrative 8.70% conflicts with table 8.30%; excluded from quantitative comparison pending correction.
Refresh trigger: Publisher correction.
- Ariel — Q2 2026 Multifamily Quarter in Review
Observation / applicability: Q2 2026; final 14 days projected. Publication: July 2026. Access and review: October 18, 2026.
Underlying provider: Ariel proprietary database; rent context attributed by publisher to Douglas Elliman Geography / asset: NYC multifamily; regulation and unit-count tiers
Statistic, NOI, sample, weighting and limits: Observed transaction discussion plus attributed forward commentary. Not independent of borough reports; not a statewide forecast.
Refresh trigger: Q3 report or final-closing correction.
- Matthews — Brooklyn H1 2026
Observation / applicability: H1 2026. Publication: September 21, 2026. Access and review: October 18, 2026.
Underlying provider: Matthews Research; underlying provider not disclosed in inspected summary Geography / asset: Brooklyn; multifamily separated from mixed use
Statistic, NOI, sample, weighting and limits: 92-bp reported average free-market/stabilized cap difference; different cohorts, not repeat sales or a universal property adjustment. NOI, weighting and cap count undisclosed.
Refresh trigger: Next H1/H2 report or clarification.
- CBRE — U.S. Cap Rate Survey H1 2026
Observation / applicability: Late June 2026 survey; six-month expectations. Publication: August 12, 2026. Access and review: October 18, 2026.
Underlying provider: More than 200 CBRE professionals; 3,600 estimates Geography / asset: National commercial-property sentiment
Statistic, NOI, sample, weighting and limits: Professional estimates and expectations; not a NY transaction series. No state probabilities inferred.
Refresh trigger: H2 survey or material financing change.
- NYC Department of Finance — Class 2 guide
Observation / applicability: 2026 guide. Publication: 2026 edition. Access and review: October 18, 2026.
Underlying provider: NYC DOF Geography / asset: NYC Class 2 properties
Statistic, NOI, sample, weighting and limits: Assessment mechanics, not a buyer tax quote. Actual/transitional values and exemptions govern.
Refresh trigger: Annual assessment, benefit expiry or rule change.
- NY Taxation — How property is assessed
Observation / applicability: Guidance accessed October 18, 2026. Publication: Page date not used as an observation. Access and review: October 18, 2026.
Underlying provider: NY State Department of Taxation and Finance Geography / asset: NY assessing jurisdictions
Statistic, NOI, sample, weighting and limits: Local assessment level and market value; no blanket statewide buyer tax rate.
Refresh trigger: Parcel roll and local rate adoption.
- NYC Rent Guidelines Board — Order 58
Observation / applicability: Covered leases commencing October 1, 2026–September 30, 2027. Publication: 2026 order. Access and review: October 18, 2026.
Underlying provider: NYC RGB Geography / asset: Covered NYC stabilized apartments and lofts
Statistic, NOI, sample, weighting and limits: Official 0% one-/two-year apartment adjustments, with stated scope and exceptions. Not all NY rents.
Refresh trigger: New order, amendment or unit applicability determination.
- NYS HCR — Good Cause Eviction
Observation / applicability: Current guidance accessed October 18, 2026. Publication: Exact day not stated. Access and review: October 18, 2026.
Underlying provider: NYS HCR Geography / asset: NYC and participating jurisdictions; exemptions apply
Statistic, NOI, sample, weighting and limits: Applicability reference, not a determination for a particular building.
Refresh trigger: Local adoption, threshold, exemption or law changes.
- NY DFS — Information for small businesses
Observation / applicability: Guidance accessed October 18, 2026. Publication: Day not stated. Access and review: October 18, 2026.
Underlying provider: NY DFS Geography / asset: Commercial property coverage guidance
Statistic, NOI, sample, weighting and limits: Coverage types and flood risk; no premium or underwriting quote.
Refresh trigger: Binding policy/renewal and updated guidance.
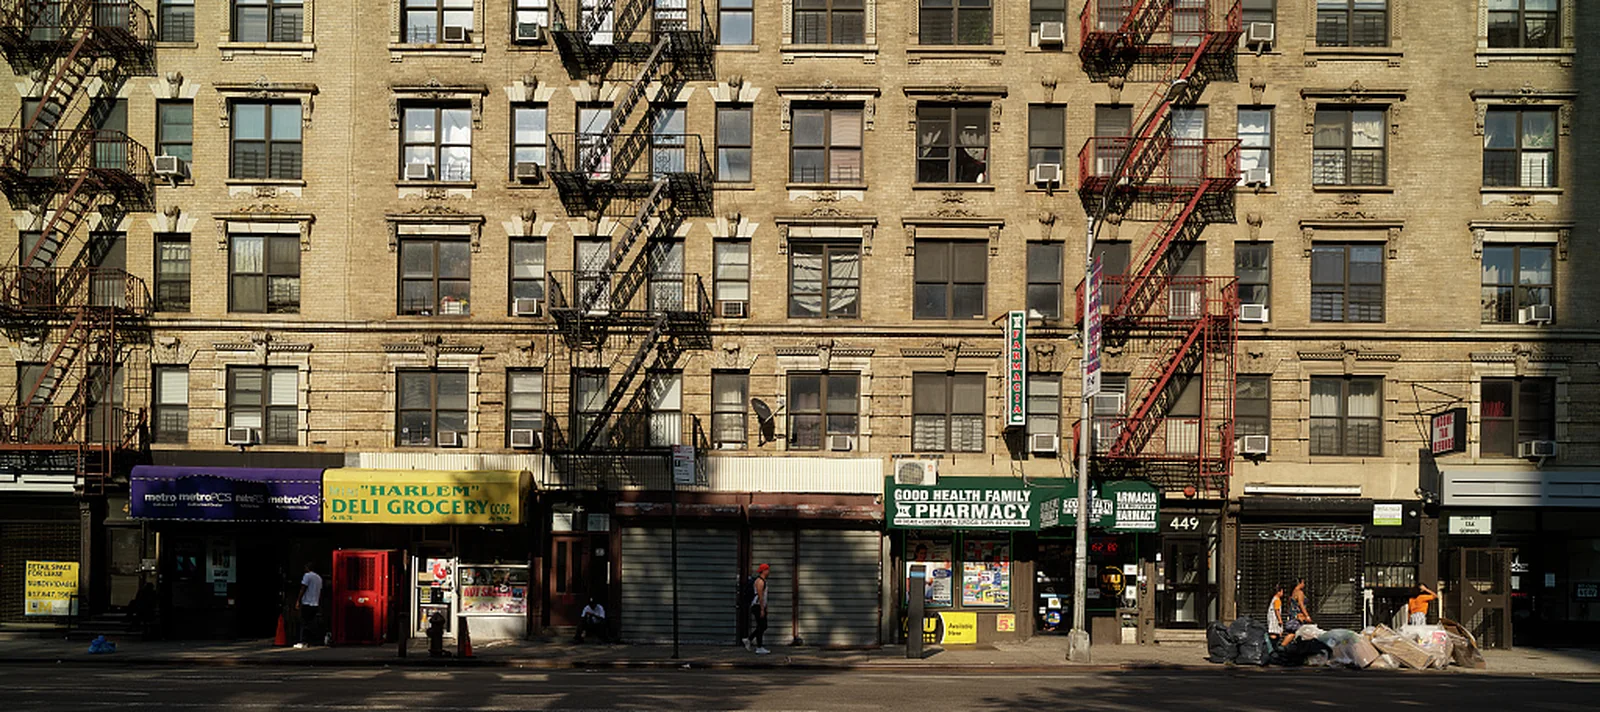
Research editions are checked against publisher directories; coverage gaps and unresolved contradictions remain beside the affected evidence. Photographs provide archival building/location context, not current property condition or appraised sale evidence. The original contribution is the comparison, underwriting logic and reproducible scenarios. Review dates advance only after substantive checking.
Send a correction with the source URL, geography and observation date.