

Texas multifamily cap rates by metro
Cap rate means annual net operating income (NOI) divided by price, before debt. The first underwriting decision is whether a published benchmark describes your building’s income basis, age and buyer pool. A tower, an older garden apartment and a duplex need different comparable sales.
Different markets, different observation windows
| Report geography | Reported cap | Observation window | Comparison that is supported |
|---|---|---|---|
| Dallas–Fort Worth | Approximately 5.25% | Q2 2026 / YTD sales | Class/vintage mix matters; see below |
| Houston | Approximately 6.00% | Q2 2026 / YTD sales | Near late-2025 levels |
| Austin | Approximately 5.00% | Q2 2026 / YTD sales | 30 bps below a year earlier |
| San Antonio | Approximately 6.00% | Q1 2026 sales (older) | 50 bps above 2024 (not YoY) |
One percentage point = 100 basis points. The public reports do not disclose cap sample sizes, weighting or a standardized trailing-versus-forward NOI convention. Total transaction counts do not equal transactions with reported caps. Do not average these rows, infer neighborhood prices, or read two decimal places as valuation precision.
Improving occupancy is not the same as improving NOI. Austin’s quarterly effective-rent recovery still leaves annual rents lower. Houston’s older classes have not shared all of the metro’s rent improvement. Acquisition taxes, insurance, concessions and repairs can absorb leasing gains before they reach NOI.
Why a county index or another publisher may differ
The Texas market directory and county pages help screen housing markets. A gross rent-to-value index is not an observed apartment NOI cap. Brokerage sale averages, modeled market caps, asking caps and professional surveys also answer different questions. Related Northmarq reports share sales providers, including CoStar and Real Capital Analytics; they are not four independent confirmations. We preserve their different operating-data providers below.
Four metros, four different recovery tests
| Metro / quarter | Vacancy | Vacancy YoY | Rent measure | Rent YoY |
|---|---|---|---|---|
| Dallas–Fort Worth Q2 2026 | 6.2% | +30 bps | Asking: $1,496 | -0.5% |
| Houston Q2 2026 | 7.1% | -30 bps | Asking: $1,350 | +1.0% |
| Austin Q2 2026 | 10.3% | -160 bps | Effective: $1,316 | -5.0% |
| San Antonio Q1 2026 | 13.4% | +220 bps | Asking: $1,091 | -5.9% |
Austin uses effective rent; the other three use asking rent. These levels are not a ranking of attainable rent. Provider coverage differs, and economic vacancy, concessions and bad debt at a subject property may differ from reported physical vacancy.
Dallas–Fort Worth: absorption improves before every vintage benefits
Observed: Northmarq reports vacancy down 60 bps in Q2 but still up 30 bps annually. Class A annual rent growth was 2.2%; Class C was down 3.8%. Its sales discussion puts Class A caps generally at 4.75–5.0% or higher, with B/C starting around 5.5% and reaching 5.75% or higher. These are open-ended descriptions, not bounded valuation bands.
Local mechanism: Frisco and Allen/McKinney account for about 30% of the construction pipeline. A northern-suburb lease-up competes with new concessions and amenities; an older Irving, Richardson or Arlington acquisition competes on achievable rent and maintenance. The broad 5.25% benchmark does not resolve that difference.
Editorial interpretation: improving absorption supports stabilization, while a lower cap for stronger assets may coexist with widening on older ones. Compression becomes less credible if Class C collections remain weak or newly stabilized northern properties expand the sale supply. Request concessions by lease, renovation downtime and a sale set matching vintage before paying for a metro recovery. Dallas County’s methodology is a local starting point, not a substitute for that sale set.
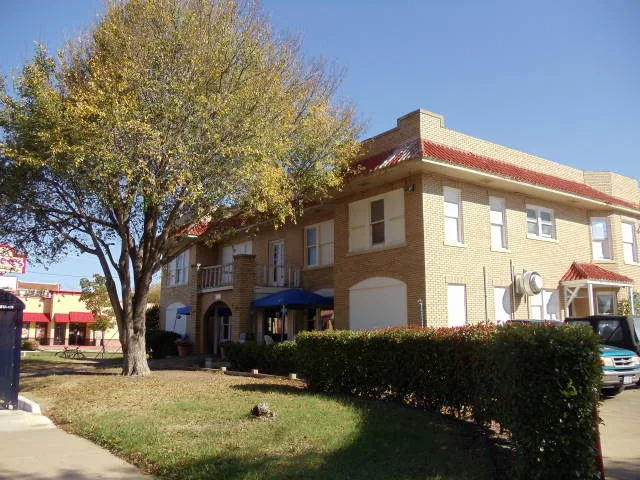

Houston: better leasing, but distinguish older stock from trophy sales
Observed: Northmarq places most 2026 caps at 5.5–6.5%, with the average near 6%. Champions/FM 1960 vacancy improved 340 bps annually to 9.1%. Yet Class B/C rents were broadly stagnant. Occupancy recovery alone has not established pricing power across older assets.
Local mechanism: the FM 1960 corridor’s older properties require a different operating budget from a newer central-city tower. A seller’s nominal rent increase can vanish through concessions or repairs. The bayou photograph also signals a separate question: obtain address-specific flood, wind and business-interruption quotes before treating the seller’s insurance expense as repeatable.
Editorial interpretation: stable caps are a defensible starting sensitivity where leasing improves but recurring costs remain uncertain. Compression needs demonstrable effective-rent gains and competitive financing. Renewed concessions, a costly insurance renewal or cash-constrained sellers would support expansion instead. Audit tenant ledgers and expense invoices; use Harris County context without transplanting a metro cap to an individual flood exposure.
Austin: one positive quarter does not restore the prior rent roll
Observed: Northmarq reports effective rent up 1.8% in Q2, its first increase in 12 quarters, but down 5.0% annually. Vacancy fell 120 bps in the quarter to 10.3%. Caps near 5% coexist with an income recovery that remains incomplete.
Local mechanism: North Austin, Cedar Park and Pflugerville were the most active sale submarkets; Class B led transactions. Those buildings do not share the downtown tower’s tenant alternatives. The report also identifies roughly 3,200 units under construction in Southeast Austin. For a nearby renovation, compare the proposed premium with competing new-unit effective rents.
Editorial interpretation: a compression case needs renewal increases and fewer concessions to persist after the initial occupancy gain. Flat caps are safer as a base sensitivity than assuming rent and valuation multiples both recover. A renewed annual rent decline or delays absorbing Southeast supply would weaken the recovery thesis. Build an expiring-lease schedule and budget loss-to-lease by unit. Travis County covers part of the metro; Austin County is a different geography and is not an Austin-city proxy.


San Antonio: separate the supply slowdown from existing distress
Observed, older window: Northmarq’s Q1 report records 6% average closed-deal caps, 13.4% vacancy and annual asking-rent decline of 5.9%. It describes increased foreclosure and distressed sales. The cap comparison is with 2024, not Q1 2025; it cannot establish a current quarterly trend.
Newer Q2 evidence: why we do not splice occupancy series
MMG’s Q2 summary reports 86.0% stabilized occupancy and a 5.4% annual effective-rent decline. Colliers’ Q2 market-trend bullets report 93.1% occupancy; its introduction inconsistently says Q1. Their public summaries do not provide enough coverage detail to reconcile the difference. We do not average the figures, infer a sequential improvement from Northmarq’s Q1 vacancy, or substitute either for a newer cap-rate sample. Ask which properties and stabilization rules a broker’s occupancy figure covers before using it.
Local mechanism: Far Northwest vacancy was 9.0%, down 240 bps annually, while North Central was 10.6%, down 180 bps. Those pockets differ from the broad vacancy reading. Northmarq forecast only 800 deliveries for the remainder of 2026 at that time. Fewer new completions would reduce competition, but would not immediately fill existing vacant units.
Editorial interpretation: assume the recovery must be earned through collections before capitalizing a stabilized pro forma. Continuing distressed sales or weak renewals would support wider caps; sustained occupied-unit gains with firm effective rents would weaken that cautious view. Require updated trailing collections, lender payoff constraints and a current closed-sale set before using the Q1 benchmark. Bexar County context cannot fill the missing newer cap sample.
What the local evidence supports—and where it stops
Irving: a historical cap benchmark, not a current neighborhood quote
GREA’s Q2 2025 Irving report described market caps near 5.9%. Its chart includes estimated, quarter-to-date and forward periods, and does not document a closed-sale cap sample. We retain this as a historical publisher benchmark, outside the 2026 comparison. The report describes a predominantly older inventory; a renovation buyer should test systems, turnover and achievable rents rather than borrow northern DFW new-build pricing.
Editorial use: this supports a reason to segment comparables, not a numeric 2026 adjustment. A newer matched sale set could invalidate the old benchmark in either direction. No current caps are asserted here for individual Dallas neighborhoods, Houston corridors, Austin suburbs or San Antonio districts.
Central Texas secondary markets: a few miles can change the rent thesis
| Report submarket | Occupancy | Annual effective-rent change | Next underwriting check |
|---|---|---|---|
| Belton | 96.5% | +3.1% | Eight-property sample: compare unit mix and renewals before extrapolating. |
| Killeen — east | 84.3% | −3.3% | Test lease expirations, concessions and military-related turnover in actual tenants. |
| Temple — south | 90.8% | −2.5% | Compare nearby completion dates with the subject’s lease-up schedule. |
| College Station — north | 91.1% | +2.1% | Separate conventional apartments from by-bed student leases and seasonal vacancy. |
TMG’s actual PDF, physical page 5, supplies these values. Its directory label refers to Tyler/Longview, but the PDF tables cover a different geography. We follow the actual tables and do not infer Tyler/Longview coverage.
Editorial interpretation: Belton’s occupied stock supports a firmer rent hypothesis than Killeen-east’s. That is not proof of cap compression in either market. A small tracked inventory can make one property matter materially; a new competing delivery, weaker renewals or concentrated tenant losses could reverse the rent thesis. In College Station, verify lease form, guarantors and turnover season before applying conventional apartment operating ratios to student housing. In Waco and Temple, match the subject to the report’s named supply area; an overall regional pipeline cannot price a specific renovation exit.
| Area | Evidence used | Still needed before underwriting |
|---|---|---|
| DFW, Houston, Austin | Q2 2026 cap benchmarks and operations; local class/supply distinctions | Matched recent closed-sale NOI, concessions and property expenses. |
| San Antonio | Q1 2026 comparable cap series; visibly older | Newer comparable sales and reconciled operating coverage. |
| Irving | Q2 2025 publisher market-cap benchmark only | Current sale-derived caps with a disclosed income basis. |
| Waco / Killeen–Temple / Bryan–College Station | June operating data; no cap-rate sample | Local sales, property scale and tenant/lease segmentation. |
| El Paso, Permian Basin, Lubbock/Amarillo, Rio Grande Valley, Gulf Coast and Tyler/Longview | No verified matching cap-rate evidence in this edition | Local closed sales and operating histories. Test employer concentration, student or seasonal leasing where applicable, and address-level weather insurance. |
No-data areas are not assigned zero caps or a larger city’s rate. This is substantial Texas coverage, not an exhaustive statewide sale database.
Compression, stabilization and expansion: what would change the view?
Publisher outlook: Northmarq’s local reports generally expect easing supply to help leasing, while its San Antonio Q1 outlook warns caps could rise until vacancy and rent stabilize. Those related forecasts are one brokerage perspective, not independent corroboration.
Separate perspective: CBRE’s H1 2026 U.S. Cap Rate Survey found roughly 60% of respondents expecting no cap change over the next six months, with more expansion pressure for Class C. These are professionals’ estimates across a national survey, not observed Texas sales. The survey’s capital-market caution can coexist with Northmarq’s improving local absorption: better apartment demand does not guarantee cheaper financing or stronger bids.
RentalCalcs base underwriting case: use a stable exit cap as the central sensitivity, alongside a wider-cap downside, until matching sales and buyer NOI justify otherwise. This is a conditional underwriting discipline, not a measured statewide forecast. Austin’s income recovery, Houston’s older-stock costs, DFW’s vintage split and San Antonio’s distress require different rent and expense paths even if the assumed cap is unchanged.
Compression case: durable income attracts stronger bids
Mechanism: occupied units translate into collected rent, supply is absorbed and competitive debt/equity reduces required yields. Austin’s quarterly recovery and improving Houston vacancy give this case something to test.
Watch: renewals net of incentives, comparable sale caps on the same NOI basis, lender spreads and quoted mortgage constants. Invalidated by: concessions returning, costs outpacing collected revenue or tighter debt sizing despite lower policy rates. Decision: treat a tighter exit as upside; do not pay today for both unproven rent growth and compression.
Stabilization case: stronger operations offset buyer friction
Mechanism: leasing improves while taxes, insurance, financing and new sale supply absorb the benefit. Houston’s near-flat cap series and CBRE’s majority no-change response support considering this case.
Watch: consistent bids and closed sales, fewer concessions, steady buyer expenses. Invalidated by: broad repricing in matched sales or repeated debt-service shortfalls. Decision: earn returns through verified NOI and sensible basis; a flat cap does not mean flat value when income changes.
Expansion case: income shortfalls meet refinancing pressure
Mechanism: weak renewals, cost surprises or forced sales increase the yield buyers require. San Antonio’s reported distress and DFW’s weaker Class C rents make the risk concrete; CBRE’s Class C caution provides a different analytical lens.
Watch: delinquency and occupancy together, actual renewal premiums, lender proceeds and seller liquidity. Invalidated by: sustained collection gains, affordable refinancing and repeated stable/tighter matched trades. Decision: combine lower NOI with a wider exit cap and budget sufficient operating cash; a high advertised cap does not cure a capital shortfall.
Short-term policy rates are only one financing input. Property borrowing costs also reflect Treasury yields or other benchmarks, lender spreads, term, leverage and amortization. A cap-to-interest-rate spread omits principal repayment and operating risk; request a live term sheet instead of treating a policy-rate cut as automatic cap compression.
How changing NOI and cap rates change property value
Value = annual NOI ÷ (cap rate ÷ 100). At $110,000 NOI and a 5.5% cap, value is $2 million. If NOI grows 10% in total but the exit cap reaches 6.5%, value falls to about $1.86 million. Income recovery can be real and still fail to preserve the purchase price.
Hypothetical assumptions. NOI change is cumulative over your chosen holding period, not an annual growth rate. Results exclude debt, sale costs, taxes and interim cash flow.
Starting value $2,000,000
Exit value $1,861,538 (-6.9%)
$110,000 starting NOI at 5.5% → $121,000 exit NOI at 6.5%. NOI must change by 18.2% to preserve starting value at this exit cap rate.
| Exit cap | -10% NOI | 0% NOI | +10% NOI | +20% NOI |
|---|---|---|---|---|
| 5.0% | -1.0% | +10.0% | +21.0% | +32.0% |
| 5.5% | -10.0% | 0.0% | +10.0% | +20.0% |
| 6.0% | -17.5% | -8.3% | +0.8% | +10.0% |
| 6.5% | -23.8% | -15.4% | -6.9% | +1.5% |
| 7.0% | -29.3% | -21.4% | -13.6% | -5.7% |
This fixed matrix does not change with the inputs above. It compares unlevered property values, excluding debt payoff, selling costs, taxes and interim cash flow. A move from 5.5% to 6.5% is +100 bps; with flat NOI, value falls 15.4%. Preserving value requires 18.2% cumulative NOI growth.
From a regional cap to a defensible offer
- Match the evidenceGeography, vintage, unit mix, sale date and actual versus projected NOI. Reject a nearby but incompatible comp.
- Rebuild buyer incomeRent roll → collected revenue → buyer taxes, quoted insurance and recurring operations → NOI. Keep capital work and reserves visible.
- Price and finance the riskCapitalize sustainable NOI, stress income and exit together, then test debt service, cash reserves and a lender’s sizing rules.
One Texas acquisition, reconciled from rent to cash
Hypothetical 20-unit acquisition at $2 million. The $1,250 monthly rent, 8% revenue loss, expenses and loan terms below are modeling assumptions, not market quotes or a recommended deal. The loss allowance combines vacancy, concessions and collection loss; verify each component before replacing it.
| Operating line | Amount | Basis / boundary |
|---|---|---|
| Scheduled rent | $300,000 | 20 × $1,250 × 12; no other income |
| Revenue loss | −$24,000 | 8% of scheduled rent |
| Effective gross income | $276,000 | Collected-revenue assumption |
| Buyer property tax | $48,000 | Illustrative parcel budget; obtain appraisal and taxing-unit rates |
| Insurance | $24,000 | Illustrative all-required-coverage budget; obtain binding quotes |
| Management | $13,800 | 5% of effective gross income |
| Recurring repairs | $24,000 | Excludes immediate capital work and reserves |
| Owner-paid utilities | $26,000 | Verify reimbursements and actual bills |
| Payroll, administration and recurring fees | $30,200 | Includes any applicable registration fee; no double addition |
| Total recurring expenses | $166,000 | Six expense rows above |
| NOI / going-in cap | $110,000 / 5.50% | Before financing, reserves and income tax |
Replace these three assumptions before making an offer
Property tax: Texas uses a January 1 valuation date, and its appraisal guidance describes an income approach relevant to apartments. Local taxing units set rates. Obtain the parcel’s appraisal, exemptions, protest status and full school/city/county/special-district stack. Do not assume the seller’s bill carries forward, apply a blanket Texas rate or import California’s acquisition-reset rules.
Insurance: TDI’s commercial guidance explains that flood is generally outside a standard property policy and coastal wind/hail may require separate coverage. Compare replacement cost versus actual cash value, deductibles, exclusions and business interruption. A low premium with a large deductible can shift risk to cash reserves. The $24,000 here is not an insurance quote or a claim that every property needs identical policies.
Local compliance and capital work: Dallas requires multi-tenant registration; its fee is $13 per unit and routine inspections occur at least every three years. For this 20-unit illustration, an applicable $260 fee is inside administration. This city rule does not describe every Texas jurisdiction. Obtain the actual inspection file and a contractor scope for roofs, drainage, HVAC and deferred work; recurring repairs do not fund every capital replacement.
| Measure | Result |
|---|---|
| Loan / interest / amortization | $1,200,000 / 6.5% / 30 years |
| Annual debt service | $91,018 |
| Annual replacement reserve, below NOI | $10,000 |
| Cash after debt and reserve | $8,982 |
| Invested cash | $900,000 = $800,000 down + $60,000 closing + $40,000 immediate work |
| Cash-on-cash, before income tax | 1.00% |
| DSCR / debt yield, before reserves | 1.21× / 9.17% |
The annual mortgage constant is 7.58%, above the 5.5% going-in cap; amortization compounds the financing drag. If a lender required 1.25× DSCR before reserves, this NOI would support only $88,000 annual debt service, or about $1,160,213 at these terms. Actual sizing also depends on LTV, debt yield and lender NOI/reserve conventions.
Yield on cost is separate: $120,000 future stabilized NOI on $2.1 million purchase, closing and immediate-work cost equals 5.71%. That hypothetical future NOI is not the current $110,000, and carrying costs or overruns would increase the denominator. Do not count an unearned renovation premium in the going-in cap.
How much can a buyer-cost surprise erase?
Hold the $2 million price, 5.5% valuation cap and financing below constant. Add an annual tax, insurance or other recurring cost above the $166,000 expense budget. This is a stress assumption, not a Texas expense forecast.
Buyer NOI $95,000 · going-in cap 4.75%
Value at 5.5% $1,727,273 · value loss $272,727
DSCR 1.04× before reserves · annual cash after debt and reserves -$6,018
At 5.5%, every additional $1 of recurring expense reduces indicated value by $18.18 if the cap stays fixed. At zero NOI the model gives zero income-capitalized value; that is not a land or redevelopment appraisal. Borrowing terms are held constant and lender covenants are not evaluated.
Core report analysis and worksheet are free. These assumptions do not transfer automatically to the linked calculators; enter your actual rent roll, buyer expenses and loan terms. A tool click is tracked separately from a completed calculation.
Before relying on a Texas cap rate
What is a good cap rate in Texas?
There is no single defensible threshold across these markets. A higher cap can compensate for weaker collections, capital work or a thin buyer pool. Compare sustainable buyer NOI and matching closed sales, then test cash-on-cash and lender coverage. The hypothetical 5.5% deal above illustrates why an apparently reasonable cap can still produce very little cash.
Can I use these apartment rates for a duplex, office or industrial building?
No automatic transfer is justified. Small rentals may compete with owner-occupants; commercial leases have different reimbursement, credit, downtime and leasing-capital risks. Use asset-specific comparable sales. For small-rental location screening, start with the Texas market-selection guide, then build the property’s NOI.
What evidence should a seller provide?
Request a dated rent roll reconciled to trailing monthly collections, concessions and delinquency; tax notices; current policies and renewal quotes; utility bills; maintenance and capital history; leases; compliance files; and sale comps with a documented NOI basis. Explain any gap between the broker’s pro forma and actual collections before choosing a cap.
How should I handle subsidized rents or a planned refinance?
Verify the payment contract, tenant portion, inspections and recurring compliance costs. The voucher-income valuation guide explains the distinction. For a refinance, test lender proceeds using stressed NOI and debt service; an appraised value increase alone does not guarantee enough cash to repay the existing loan.
Bring the evidence to the property
The printable worksheet keeps the comp basis, buyer costs, cap sensitivity and debt coverage together, with space for missing documents and the evidence that would change your thesis.
Open the free Texas underwriting worksheetSources, lineage and update policy
This edition was researched October 18, 2026. Northmarq’s latest-report directory and local offices were checked; older search results were superseded where a newer actual report was available. San Antonio’s matching cap series remains older. Public summaries do not disclose enough detail to harmonize NOI definitions or reconstruct transaction weighting. No proprietary sale file was inspected and no photographed building was appraised.
Reported observations, attributed publisher forecasts and RentalCalcs’ conditional interpretation are labeled separately. The report’s original contribution is the comparison, local underwriting logic, scenarios and cost-to-value bridge. It does not supply a statewide average, neighborhood interpolation or investment recommendation.
Open the source ledger: dates, providers, coverage and refresh triggers
- Northmarq — Dallas–Fort Worth Q2 2026
Observation: Q2 2026 operations; YTD sales. Published: September 30, 2026 (companion article). Accessed: October 18, 2026.
Underlying provider: RealPage (operations); CoStar/RealPage (development); Northmarq, CoStar, MSCI Real Capital Analytics and Green Street (sales). Geography / asset: DFW multifamily report geography; property classes discussed separately.
Statistic, NOI, sample and weighting: Reported average cap approximately 5.25%; 72 YTD transactions is the all-sales count, not a disclosed cap-rate sample. Cap weighting, NOI convention and cap-observation count undisclosed.
Refresh trigger: Q3 report or correction; refresh operating and sales interpretation together.
- Northmarq — Houston Q2 2026
Observation: Q2 2026 operations; YTD sales. Published: August 19, 2026 (companion article). Accessed: October 18, 2026.
Underlying provider: Northmarq/REIS (operations); CoStar/REIS (development); Northmarq, CoStar and Real Capital Analytics (sales). Geography / asset: Houston multifamily report geography.
Statistic, NOI, sample and weighting: Reported average cap 6.0%; typical reported transaction range 5.5–6.5%. Cap count, weighting and NOI convention undisclosed. Not a range for every Houston property.
Refresh trigger: Next quarterly report; realized effective rents and operating expense evidence.
- Northmarq — Austin Q2 2026
Observation: Q2 2026 operations; YTD sales. Published: August 21, 2026 (companion article). Accessed: October 18, 2026.
Underlying provider: Apartment Insights (operations/development); Northmarq, CoStar and Real Capital Analytics (sales). Geography / asset: Austin metropolitan apartment market, including suburban submarkets; not Austin County.
Statistic, NOI, sample and weighting: Reported average cap near 5.0%; reported 30-bp annual compression. Effective rent includes incentives under provider methodology, not a subject rent roll. Cap sample, weighting and NOI convention undisclosed.
Refresh trigger: Q3 edition; test annual rent recovery as well as quarterly improvement.
- Northmarq — San Antonio Q1 2026
Observation: Q1 2026. Published: June 22, 2026 (companion article). Accessed: October 18, 2026.
Underlying provider: Northmarq/REIS (operations); CoStar (development); Northmarq, CoStar and Real Capital Analytics (sales). Geography / asset: San Antonio multifamily report geography.
Statistic, NOI, sample and weighting: Reported average cap 6.0%, versus 5.5% in 2024; not a year-over-year comparison. Twelve transactions is the all-sales count, not disclosed cap coverage. Cap weighting and NOI convention undisclosed. Older evidence kept visibly dated.
Refresh trigger: A newer comparable cap-rate edition; do not use different occupancy providers as a continuous series.
- GREA — Irving submarket, Q2 2025
Observation: Q2 2025 report; historical benchmark. Published: 2025; exact day not stated in PDF. Accessed: October 18, 2026.
Underlying provider: GREA report; public figure does not fully document underlying cap series methodology. Geography / asset: Irving multifamily submarket; building vintage mix differs from northern DFW new construction.
Statistic, NOI, sample and weighting: Market cap near 5.9% in narrative; chart includes estimated/QTD and forward periods. Treat as publisher market benchmark, not verified closed-sale median. Sample, weighting and NOI convention undisclosed; never a current 2026 neighborhood quote.
Refresh trigger: New matching Irving report or verified local closed-sale comps.
- The Multifamily Group — Central East Texas, June 2026
Observation: June 2026. Published: June 2026 edition; day not stated. Accessed: October 18, 2026.
Underlying provider: Yardi Matrix / MarketPoint. Geography / asset: Actual PDF covers Waco, Temple, Killeen, Belton and Bryan/College Station. Directory label mentions Tyler/Longview, which does not establish coverage.
Statistic, NOI, sample and weighting: Submarket occupancy and annual rent growth; no verified NOI cap sample. Inventory and property coverage are provider-defined, not all rental homes. Weighting and treatment of student inventory not fully disclosed in displayed tables.
Refresh trigger: Next matching report and actual table geography, not directory label alone.
- MMG — San Antonio Q2 2026
Observation: Q2 2026. Published: Exact publication day not stated in summary. Accessed: October 18, 2026.
Underlying provider: MMG summary; underlying operating provider not disclosed on the inspected page. Geography / asset: San Antonio multifamily; stabilized occupancy stated.
Statistic, NOI, sample and weighting: 86.0% stabilized occupancy and effective rent down 5.4% annually. No matching cap sample; inventory boundaries and weighting not disclosed. Not reconciled with Colliers or spliced onto Northmarq.
Refresh trigger: Underlying coverage clarification or next report.
- Colliers — San Antonio Q2 2026
Observation: Q2 2026 market trends; introduction inconsistently says Q1. Published: July 28, 2026. Accessed: October 18, 2026.
Underlying provider: Colliers summary; underlying operating provider not identified in inspected summary. Geography / asset: San Antonio multifamily market occupancy; coverage not reconciled with MMG.
Statistic, NOI, sample and weighting: 93.1% occupancy in Q2 market-trend bullets. Full-report viewer was not accessible in this research pass. No cap observation used; no averaging with MMG. Inconsistent introductory period disclosed.
Refresh trigger: Full methodology/coverage clarification, correction or next report.
- CBRE — U.S. Cap Rate Survey H1 2026
Observation: June 2026 survey; next-six-month outlook. Published: August 12, 2026. Accessed: October 18, 2026.
Underlying provider: CBRE Capital Markets and Valuation professionals. Geography / asset: U.S. commercial-property survey, including multifamily; not a Texas transaction sample.
Statistic, NOI, sample and weighting: Professional estimates and expectations, not sale averages. Roughly 60% expect unchanged caps; Class C has stronger expansion expectations. Commercial advisory perspective; no Texas-wide forecast inferred.
Refresh trigger: H2 survey or material change in borrowing costs / capital availability.
- Texas Comptroller — Valuing property
Observation: Guidance accessed October 18, 2026. Published: Page date not stated. Accessed: October 18, 2026.
Underlying provider: Texas Comptroller of Public Accounts. Geography / asset: Texas appraisal guidance; local districts determine parcel treatment.
Statistic, NOI, sample and weighting: January 1 valuation; income approach is relevant to apartments. Not a tax quote, blanket rate or assurance of exemption transfer.
Refresh trigger: Statutory guidance changes and each parcel’s appraisal / tax notices.
- Texas Comptroller — Property tax basics
Observation: Guidance accessed October 18, 2026. Published: Page date not stated. Accessed: October 18, 2026.
Underlying provider: Texas Comptroller of Public Accounts. Geography / asset: Texas local taxing units.
Statistic, NOI, sample and weighting: Local units set rates; Texas does not impose a state property tax. Obtain the subject’s complete taxing-unit stack.
Refresh trigger: Annual adopted rates and parcel-specific district changes.
- Texas Department of Insurance — Commercial property insurance
Observation: Current guidance at review. Published: December 9, 2025 update. Accessed: October 18, 2026.
Underlying provider: Texas Department of Insurance. Geography / asset: Commercial property coverage in Texas; policy terms and location govern.
Statistic, NOI, sample and weighting: Flood generally excluded; coastal wind/hail may require separate coverage. Replacement cost, actual cash value, deductibles and interruption coverage differ. No premium estimate supplied.
Refresh trigger: Binding quote, renewal, exposure change or updated guidance.
- City of Dallas — Multi-Tenant Registration
Observation: Fee effective October 1, 2025. Published: Page date not stated. Accessed: October 18, 2026.
Underlying provider: City of Dallas Code Compliance. Geography / asset: Applicable properties inside Dallas city limits, not the entire metro.
Statistic, NOI, sample and weighting: Registration fee $13 per unit; routine inspection at least every three years. Verify applicability and current compliance file; administrative fee is not the full cost of compliance.
Refresh trigger: Fee schedule or inspection requirements change; acquisition diligence.
Brokerages have commercial advisory interests. Shared CoStar/RCA inputs do not become independent evidence when republished under another logo; CBRE’s professional survey offers a different perspective, not transaction corroboration. Revisit on new quarterly reports, material corrections, financing changes and relevant tax, insurance or local-rule updates. Review dates change after substantive checking, not every build.
Send a correction with the source and observation date · Texas county directory · Compare California’s separately researched report