Buffalo rent & investment research · NY
Buffalo metro rent report
A Buffalo rent premium is only useful after the heating bill and the actual campus commute.
Zillow all-home metro asking-rent index · All bedroom counts · Seasonally adjusted
By RentalCalcs editorial · Reviewed


The investment view
Favor a legally usable small rental with documented collections, known utility responsibility and funded winter repairs. A heat-included lease may advertise more rent while leaving less income. University demand can support a good location, but “near UB” is incomplete without identifying which campus and how the resident reaches it.
Buffalo’s rent index covers Erie and Niagara counties, not just city apartments
The latest typical asking rent is $1,451 monthly. The official Buffalo-Cheektowaga metro includes Erie and Niagara counties; both are present in Zillow’s Buffalo provider market. The provider’s shorter label does not make this a City of Buffalo estimate.
Monthly rent data
| Month | Typical rent |
|---|---|
| September 2021 | $1,126 |
| October 2021 | $1,134 |
| November 2021 | $1,144 |
| December 2021 | $1,152 |
| January 2022 | $1,160 |
| February 2022 | $1,168 |
| March 2022 | $1,176 |
| April 2022 | $1,185 |
| May 2022 | $1,193 |
| June 2022 | $1,200 |
| July 2022 | $1,209 |
| August 2022 | $1,217 |
| September 2022 | $1,224 |
| October 2022 | $1,229 |
| November 2022 | $1,236 |
| December 2022 | $1,243 |
| January 2023 | $1,253 |
| February 2023 | $1,255 |
| March 2023 | $1,261 |
| April 2023 | $1,264 |
| May 2023 | $1,270 |
| June 2023 | $1,275 |
| July 2023 | $1,283 |
| August 2023 | $1,289 |
| September 2023 | $1,292 |
| October 2023 | $1,297 |
| November 2023 | $1,302 |
| December 2023 | $1,308 |
| January 2024 | $1,310 |
| February 2024 | $1,318 |
| March 2024 | $1,327 |
| April 2024 | $1,333 |
| May 2024 | $1,336 |
| June 2024 | $1,338 |
| July 2024 | $1,341 |
| August 2024 | $1,345 |
| September 2024 | $1,353 |
| October 2024 | $1,359 |
| November 2024 | $1,365 |
| December 2024 | $1,368 |
| January 2025 | $1,370 |
| February 2025 | $1,370 |
| March 2025 | $1,370 |
| April 2025 | $1,378 |
| May 2025 | $1,383 |
| June 2025 | $1,389 |
| July 2025 | $1,391 |
| August 2025 | $1,394 |
| September 2025 | $1,395 |
| October 2025 | $1,397 |
| November 2025 | $1,400 |
| December 2025 | $1,404 |
| January 2026 | $1,410 |
| February 2026 | $1,417 |
| March 2026 | $1,422 |
| April 2026 | $1,423 |
| May 2026 | $1,428 |
| June 2026 | $1,432 |
| July 2026 | $1,438 |
| August 2026 | $1,445 |
| September 2026 | $1,451 |
This all-home, all-bedroom index is useful for the direction of asking rents. It cannot tell an owner what a particular upper flat should collect, whether heat is included or whether a student lease is priced by bedroom. Compare whole-unit monthly obligations first and identify separately any utilities or services.
Growing asking rents need not produce an equal improvement in spendable income. A newly advertised rent affects the owner only after a lawful lease change, collection and expenses. The existing lease book, rather than an index extrapolation, belongs in the first-year acquisition budget.
The latest utility forecast is lower; your building still needs its own fuel history
National Fuel’s October 19 outlook projects about $742 for a typical residential customer’s November–March 2026–27 heating season, versus $780 last winter. Its assumed usage is 71.3 thousand cubic feet. This is contrary evidence to a blanket claim that every Buffalo heating bill is rising.
It is also a five-month forecast for a typical customer, not a full-year expense estimate for a two-unit building. Floor area, equipment, insulation, occupancy, weather and which loads share a meter can change the result. Obtain at least a complete year of bills, preferably multiple winters, with usage and actual versus estimated readings.
Read the lease’s utility allocation and reconcile it to the physical meters and equipment. An owner-paid shared heating system belongs in operating expenses before NOI. Separately billed tenant heat belongs in the renter’s total housing comparison, while the owner still needs a plan for any common-area service, vacant-unit protection and equipment maintenance it must pay.
A fixed utility allowance or seller’s summertime bill can hide seasonal timing. Budget cash for winter months even if the annual return appears adequate. A projected reduction in typical fuel spending does not remove a known boiler replacement or roof repair.
A $1,200 fuel overrun takes roughly $53 more monthly rent from each unit to replace
Assume a two-unit property has a $4,800 annual owner-paid fuel budget. A 25% overrun costs $1,200. With 94% of scheduled rent collected, replacing that amount requires about $53 per unit per month. The inputs are hypothetical; the 25% stress is not National Fuel’s forecast.
Hypothetical fuel sensitivity · two units · 94% collections
| Fuel-cost change | Annual cost change | Monthly rent equivalent per unit |
|---|---|---|
| -5% | -$240 | -$11 |
| 10% | $480 | $21 |
| 25% | $1,200 | $53 |
| 50% | $2,400 | $106 |
Now compare two hypothetical offers: $1,500 with heat included versus $1,400 with the resident paying heat. The $100 premium on two units produces $2,256 in annual collections at 94%, less than the assumed $4,800 owner fuel bill. Holding everything else equal, the higher headline rent leaves $2,544 less before other expenses. This comparison requires genuine substitutes with equivalent space, condition and service; it does not justify unilaterally changing a lease.
Efficiency work can change the comparison, but price the scope and measure likely savings before paying for it. Do not treat an equipment seller’s projected reduction as collected rent or count the same savings in both the fuel budget and a rent premium.
North Campus in Amherst, South Campus and Downtown create different searches
UB identifies North Campus in Amherst as the location of most core academic programs. South Campus sits in Buffalo, while Downtown Campus is in the medical corridor. Those are three distinct destinations within a much larger two-county rent market.
| Destination | Check before assigning a premium |
|---|---|
| North Campus, Amherst | Actual class or work location, parking and current shuttle connections; compare relevant Amherst housing. |
| South Campus, Buffalo | Walking route and current onward transportation; distinguish a whole flat from a per-bedroom student offer. |
| Downtown medical corridor | Specific workplace, shift-time access and full-year versus academic-year lease needs. |
Use the university’s current maps and travel resources. A planned transit improvement is not a present commute. Enrollment and institutional investment also do not equal a count of new private tenants: existing campus housing, commuters and different program locations matter.
A documented student tenancy can be a sound source of income. Check the actual lease term, payment responsibility and turnover schedule before annualizing a bedroom rate. A ten-month quote cannot be multiplied by twelve unless the other two months have separately supported income.
A low purchase price does not fund a double’s winter capital needs
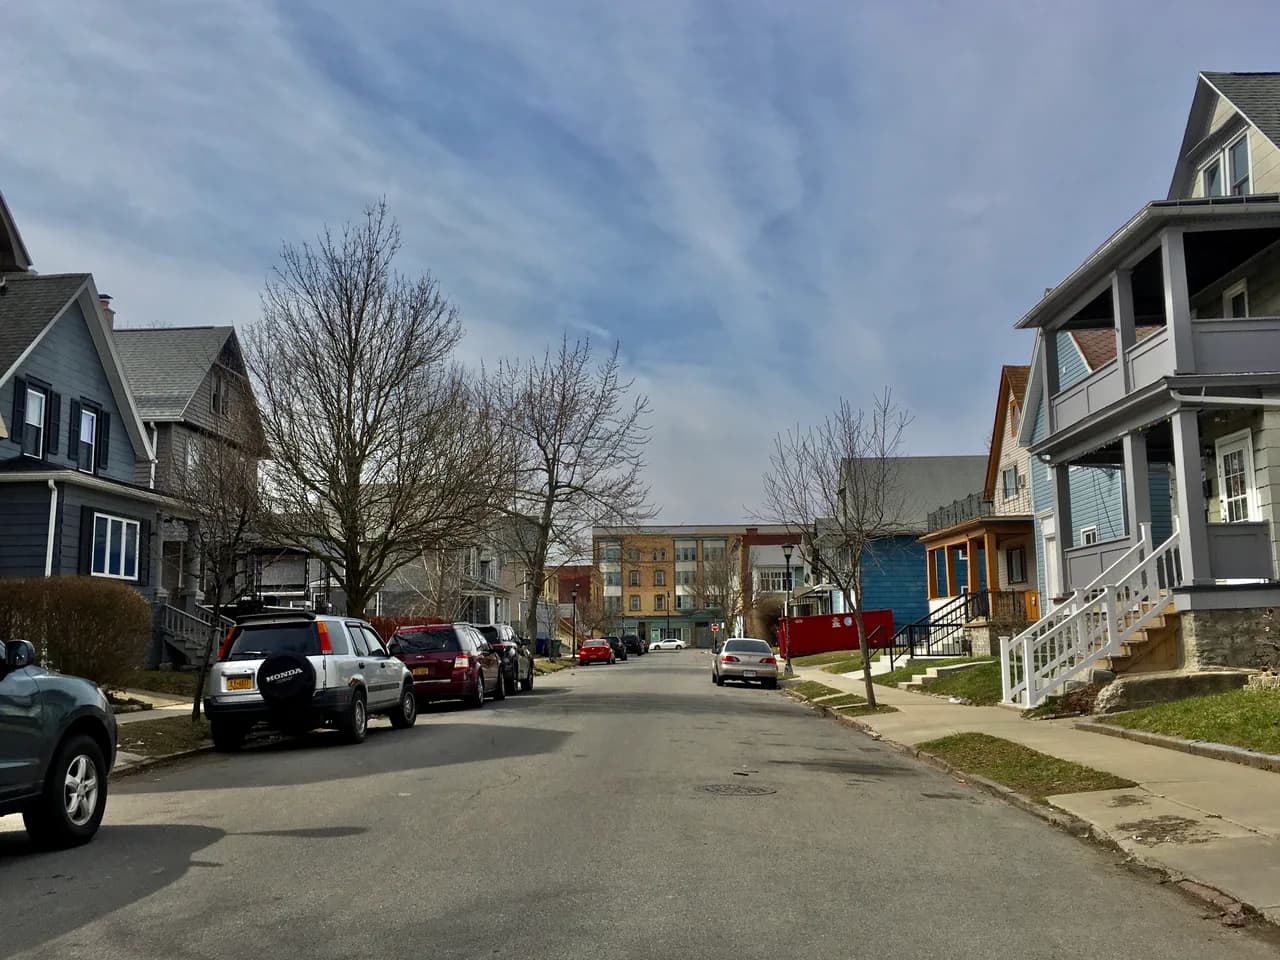

For a Buffalo double, confirm the permitted two-unit use, separate living facilities and the condition of heating, roof, drainage and plumbing. Identify common systems and responsibilities from inspection and records. A street photograph or a listing’s unit count cannot establish legal use or the cost to operate it.
Request line-item contractor pricing for known work and keep that cash distinct from an annual replacement reserve. Add vacancy carry if the scope prevents occupancy. A new kitchen does not compensate for unpriced heating equipment, and a tenant-paid gas bill does not prove the owner has no system-replacement obligation.
Build a same-unit comp sheet using the Buffalo ZIP rent reference, then verify actual leases. Erie County research broadens the investment context without turning Niagara County or Amherst values into city-flat rents.
Test a $220,000 double after operating costs, repairs and debt
Assume two whole-unit leases at $1,500 monthly, 6% loss, $13,000 annual operating expenses including $4,800 owner-paid fuel, and $2,400 annual capital reserves. Initial repairs are $20,000. Financing assumes 65% loan-to-price, 7% interest and 30-year amortization. This is a hypothetical case; replace every input with the subject’s verified terms.
Acquisition lab · assumed Buffalo property
Editable assumptions, not an available listing or financing quote. Closing costs are fixed at 3% of purchase price; repairs are paid upfront. No appreciation, tax benefits, refinancing proceeds or rent growth are needed to generate the results.
Edit property assumptions
| Measure | Base | Downside |
|---|---|---|
| Scheduled rent | $36,000 | $34,200 |
| After vacancy / collection loss | $33,840 | $31,122 |
| Net operating income (NOI) | $20,840 | $16,822 |
| Annual loan payments | $11,417 | $11,417 |
| Cash after debt + capital reserve | $7,023 | $3,005 |
| Debt coverage (NOI ÷ payments) | 1.83× | 1.47× |
NOI excludes financing and capital reserves. Operating expenses must include taxes, insurance, management, routine maintenance and owner-paid utilities. A reserve reduces spendable cash; it does not make a known roof or sewer replacement disappear. Results describe a stabilized year after initial repairs. Fund renovation downtime and carrying costs separately; they are not estimated here.
| Required yield | Base NOI | Downside NOI |
|---|---|---|
| 6.5% | $291,860 | $231,845 |
| 7.5% | $250,356 | $198,343 |
| 8.5% | $218,618 | $172,724 |
A price below a yield ceiling can still fail debt coverage or require more cash than you have. Check the loan terms, unit-level leases and a contractor’s scope before treating a modeled ceiling as an offer.
The standard downside increases all operating expenses by 10%. To isolate the fuel case, instead edit the base expense budget by its incremental dollar amount; do not add overlapping fuel shocks twice. The one-to-four-unit rental calculator supports a fuller financing review. If one unit is owner-occupied, the house-hack calculator separates the owner’s housing benefit from rental collections.
Buy a verified expense advantage; retain good leases when turnover consumes the premium
Acquire when the legal unit configuration, paid rents, utility allocation and priced repairs support income at the offered basis. Favor a demonstrable operating advantage over a cosmetic rent premium.
Hold or renovate selectively when measured fuel use and maintenance records identify work that protects service or improves costs. Compare that return with a vacant cosmetic turn, including lost rent and winter carry.
Pass or reprice when the seller omits shared heat, assumes year-round room income from a shorter lease, or prices every address as equally convenient to UB. Reconsider when bills, legal-use records, executed leases and a funded capital scope resolve those uncertainties. Strong collections after documented efficiency work would support a higher valuation than an unverified “heat included” premium.
Questions behind a Buffalo rent comparison
Is heat included in the metro benchmark?
The index is not a utility-normalized quote for the subject. Read each actual lease and compare rent plus resident-paid bills and mandatory fees.
Can I use the utility’s $742 forecast for a double?
No. It describes a typical residential customer for five winter months. Use the building’s full-year usage, meter configuration and current service terms.
Does “near UB” establish a student rent premium?
No. Identify the campus, actual travel options, unit-versus-bedroom pricing and supported lease duration. The university’s geography is a starting point for selecting comps, not a property income guarantee.
Sources and methodology
Evidence behind this report
- National Fuel, October 19, 2026 winter outlook: $742 projected November–March residential heating cost at 71.3 Mcf usage, versus $780 last winter. Forecast for a typical customer, not a Buffalo multifamily property budget.
- University at Buffalo, Our Campuses: North in Amherst, South in Buffalo, Downtown in the medical corridor; geography and academic uses checked October 20, 2026. No private-rental demand count inferred.
- UB visiting and transportation resources: current campus directions, maps and travel options. Verify the actual route and schedule for a prospective lease.
- Zillow all-home, all-bedroom, smoothed, seasonally adjusted metro ZORI CSV; observation 2026-09-30; retrieved 2026-10-20T07:45:10.471Z UTC
- Zillow repeat-rent methodology
- Census July 2023 metro delineations
- Zillow county-to-metro crosswalk, retrieved 2026-10-20
Geography and comparable populations
Official July 2023 county membership matches the counties in Zillow’s undated provider crosswalk, retrieved October 20, 2026. Provider RegionID and CBSA are distinct identifiers. The official name is Buffalo-Cheektowaga; the provider uses Buffalo and its crosswalk retains the older Buffalo-Cheektowaga-Niagara Falls label. Official CBSA: 15380; separate Zillow RegionID: 394425. County and city figures are useful local checks but cannot reproduce this metro index.
| County | State | Zillow crosswalk |
|---|---|---|
| Erie County | NY | Included |
| Niagara County | NY | Included |
What the rent index measures
ZORI follows repeat asking-rent changes, weights toward the rental stock and smooths observations. It does not measure every signed lease, concessions, a two-bedroom quote, property income or a voucher payment standard. Broker apartment surveys have their own boundaries and property populations. Their vacancy and effective-rent readings are labeled by period and are never averaged into ZORI.
The headline and historical chart use one validated version. The file contains 740 metro rows; 740 have a latest-month observation. These are market counts, not rental-unit sample sizes; Zillow does not supply underlying unit sample counts here. Missing observations remain missing and prior months may be revised.
Refresh and editorial review
Provider Last-Modified: Fri, 16 Oct 2026 01:56:12 GMT. This page serves the stored published version. The shared weekly refresh publishes validated versions atomically and retains the previous version on failure. Changed interpretation is flagged for review; imports do not advance the editorial review date. Local broker studies and photographs retain their own dates.
This newly reviewed history comes from the committed download retrieved 2026-10-21T11:08:53.868Z; its complete source-file fingerprint, period and coverage match the stored publication. The next changed-source import stores all reviewed histories together.
SHA-256: cf1ac2ab12236da3e05a81d06542e6fb95581704c6e9f375424e73b72ccb444b
Investment judgments are RentalCalcs’ analysis of the stated evidence. Purchase examples are explicitly assumed underwriting cases, not listings, appraisals, financing quotes or observed market cap rates. Report a correction.