

The answer, with the right boundaries
How much is rent in New York City?
The median of our 148 tracked NYC ZIP rent indices is $3,128 a month. The arithmetic mean is $3,530. Both summarize ZIP benchmarks across the five boroughs; neither is the rent paid by the average NYC household or a quote for a particular apartment.
NYC ZIP median
$3,128
148 ZIPs · all unit sizes
NYC ZIP mean
$3,530
Each tracked ZIP has equal weight
New York State ZIP median
$2,701
388 ZIPs · includes NYC
The practical takeaway: “New York rent” needs a geography. A statewide figure includes places far outside NYC, while a Manhattan figure leaves out four boroughs. Even a five-borough summary combines apartments of different sizes and conditions. Start with the borough and ZIP, then match the actual unit.
Data: Zillow Research ZORI, stored observations September 2026–September 2026. Calculations: RentalCalcs. Read the weighting and coverage limits.
Investment research · reviewed October 20, 2026
NYC’s renewal freeze makes the legal rent roll more important than the asking-rent index
New York has two separate income questions: what a comparable vacant apartment could ask, and what the owner may lawfully collect from the actual tenants. A borough premium does not resolve that difference.
Underwriting conclusion. For a stabilized acquisition, price the documented existing income and the capital plan first. For a market-rate property, establish the competitive set and applicable tenant protections before using borough asking rents. Upstate acquisitions need their own compliance and operating-cost evidence.
Applicable renewal guideline + unit rent history
Underwrite the lawful collectible rent. The 2026–27 ordinary guideline is 0%; separately authorized adjustments need evidence.
Executed comparable leases + Good Cause coverage review
A market asking-rent index helps find competitors; it does not resolve legal coverage, concessions or arrears.
Local inspection, registration and unit records
Price compliance work and downtime before comparing cash income with NYC.
Sources and legal windows are cited in the market analysis below. This route is a diligence framework, not a determination of any apartment’s legal status.
The interpretations and conditional actions below are RentalCalcs editorial analysis. Source observations keep their own periods. They do not establish a purchase recommendation, a property’s permitted rent or current leasing results.
NYC · stabilized apartments
The 2026–27 freeze removes the ordinary renewal increase from the base case
The NYC Rent Guidelines Board adopted a 0% annual adjustment for covered one- and two-year apartment leases commencing October 1, 2026 through September 30, 2027, together with any further adjustments authorized by law. This is an adopted renewal guideline, not a market-rent forecast or a finding about an individual apartment’s coverage.
- NYC RGB adopted 2026–27 guidelines · Adopted June 25, 2026; lease window October 2026–September 2027 · accessed October 20, 2026.
A seller’s projected rent growth can therefore describe a different revenue stream from the one the buyer acquires. With ordinary renewal rent flat, higher insurance, taxes or owner-paid utilities reduce NOI unless another documented income or expense change offsets them. Strong citywide demand cannot itself close that gap.
Investment action. Underwrite each occupied unit from its lease, preferential rent where relevant, registrations and lawful collection history. Remove an assumed ordinary renewal increase in the order’s window. Proceed to price negotiation only after the resulting NOI can support the proposed financing and required building work.
What would change the conclusion. A genuinely exempt unit, another lawful adjustment or lower documented expenses can change the result. None should be assumed from an asking-rent listing or the building’s appearance. Revisit the thesis when a later order governs the actual lease commencement date.
Records to obtain. Unit-by-unit rent and regulatory history, lease dates, arrears ledger, expense invoices, open violations and a priced capital inspection.
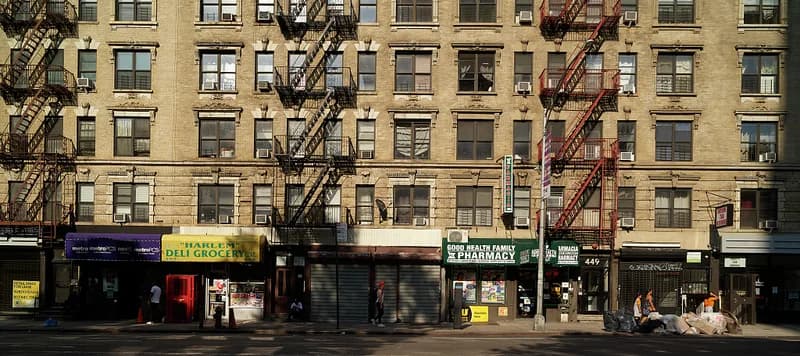
Harlem’s mixed-use frontage illustrates a second diligence question: residential and commercial rent rolls need separate lease and expense analysis. The exterior does not establish a unit’s regulated status.
August 29, 2018 · Carol M. Highsmith / Library of Congress · Original photograph · No known publication restrictions. Proportionally resized and converted to WebP; no scene changes. Archival location context.Manhattan, Brooklyn and Queens · market-rate underwriting
Brooklyn’s rental listings fell 18.4%; the supply squeeze still does not price a walk-up
StreetEasy’s September 2026 report records rental inventory down 15.3% citywide over the year, 18.4% in Brooklyn and 5.4% in Queens. This is advertised inventory, not a physical vacancy rate. Separately, New York’s Good Cause framework covers some otherwise unregulated homes, with exclusions and a local rent standard.
- StreetEasy September 2026 NYC housing report, rental section · Published October 15, 2026; September advertised rental inventory; a Zillow-group source, not independent confirmation of ZORI · accessed October 20, 2026.
- NYS HCR Good Cause guidance and current notice · Current guidance; August 2026 notice listed at access · accessed October 20, 2026.
Fewer advertised alternatives support the case for researching current market-rate leasing, but inventory can also change through withdrawals and tenant retention. A smaller building still competes through floor, light, transit access, layout and services. A shortage does not establish an elevator-building premium for a walk-up or eliminate repair downtime.
Investment action. For a market-rate walk-up, obtain recent signed leases or documented executed renewals from comparable buildings, then underwrite a separate initial renovation/lease-up period. Check Good Cause coverage and the current official notice before assigning renewal increases. Prefer a deal that works on verified occupied income over one relying on unverified tenant turnover.
What would change the conclusion. A return of listings, slower viewing-to-lease conversion or a competing local lease-up would weaken the scarcity case. A legally rentable unit with close executed comparables can justify a different initial rent. Arrears and required work remain separate collection risks even when advertised inventory is low.
Records to obtain. Executed comparable leases, unit inspection, legal coverage review, contractor schedule and tenant receivables; asking listings alone are insufficient.
Rochester and Buffalo · small rentals
Rochester certificates and Buffalo lead obligations belong in the first-income budget
Rochester operates renewable Certificates of Occupancy with scheduled inspections for residential rentals. Buffalo’s code requires rental-unit registration, with exceptions including owner-occupied properties with two or fewer units and buildings under its separate certificate program; Erie County separately applies its lead registry to pre-1980 properties with two or more units in designated communities of concern.
- Rochester Certificate of Occupancy program · Current municipal program, checked October 20, 2026 · accessed October 20, 2026.
- Buffalo rental-unit registration code · Current municipal guidance · accessed October 20, 2026.
- Erie County lead-registry coverage · Links to county lead program; coverage requires address verification · accessed October 20, 2026.
These are transaction and operating obligations, not reasons to assume every older building is defective. They make an unpriced repair allowance especially weak evidence for a small-building purchase. The rent table can narrow a location search; it cannot show whether a property is legally ready to produce the advertised income.
Investment action. Make the inspection/registration record and priced corrective work part of diligence before lifting contingencies. In Rochester, reconcile the certificate with the actual unit count and use. In Buffalo, check both municipal registration and county lead-program coverage for the address. Carry work and downtime separately from recurring maintenance.
What would change the conclusion. Current documentation and a clean inspection can reduce this uncertainty; a large project or nonresidential conversion can have a different approval path. We have not verified a current matched apartment vacancy series for either city in this edition, so we do not rank their leasing strength against NYC.
Records to obtain. Current certificates, registration, inspection notices, lead records where applicable, contractor quotes, tax and insurance estimates for the buyer.

Rochester: the upstate search requires its own rent, inspection and property-cost records. NYC borough evidence does not price this market.
August 4, 2018 · Carol M. Highsmith / Library of Congress · Original photograph · No known publication restrictions. Proportionally resized and converted to WebP; no scene changes. Archival location context.For the purchase-price side, use the new york cap-rate research with its own transaction dates and property cohorts. A cap rate from another sample should not be multiplied by this page’s ZIP index to value a property.
How much expense growth can a flat-rent NYC unit absorb?
The adopted renewal freeze motivates a flat-rent stress test. These inputs are an invented occupied-unit budget, not a typical stabilized rent or expense survey. The model does not determine legal rent. Start with the lawful amount actually collectible, then replace every cost with the subject’s records.
Illustration · one apartment · first 12 months · USD. Editable assumptions, not observed market averages or an acquisition recommendation. All recurring amounts are allocated per apartment. No appreciation, sale proceeds or tax benefits are assumed.
Annual cash after operating costs, debt and reserve contribution
$752This is a positive illustration margin, before initial capital work, income tax and sale costs.
- Scheduled rent
- $21,600
- − Vacancy / noncollection
- -$648
- − Occupied-share concession
- -$0
- = Effective rental income
- $20,952
- − Operating expenses
- -$11,000
- = NOI before debt / reserves
- $9,952
- − Debt service
- -$8,000
- − Reserve contribution
- -$1,200
- = Annual cash margin
- $752
NOI excludes debt service and this worksheet’s reserve contribution. Initial renovation, acquisition costs and initial downtime are outside this annual operating illustration. Do not subtract the same vacancy, incentive or repair expense twice.
On a narrow screen, scroll the table sideways to compare all three expense budgets.
| Collected occupancy | Entered expenses | Expenses +10% | Expenses +20% |
|---|---|---|---|
| 95% | $320Cash remaining | -$780Cash deficit | -$1,880Cash deficit |
| 90% | -$760Cash deficit | -$1,860Cash deficit | -$2,960Cash deficit |
| 85% | -$1,840Cash deficit | -$2,940Cash deficit | -$4,040Cash deficit |
Occupancy here is the collected share of scheduled rent before incentives, not a count of occupied doors. At the entered costs, break-even collected occupancy is 93.5%. Debt-service coverage is 1.24× NOI / debt service; it excludes reserve contributions.
For the stated illustration, a thin cash margin should change the financing or price discussion. Do not cure an operating deficit by assuming an ordinary renewal increase the applicable order does not provide. Capital work, arrears and commercial income still need their own schedules.
Use the full property cash-flow calculator for the purchase price, financing terms and holding period. Review its expense and reserve conventions before transferring assumptions; this illustration does not automatically populate a deal.
NYC borough ZIP-index medians and coverage
Each value below is the median of the tracked ZIP indices in that borough. Boroughs with fewer tracked ZIPs are still shown; coverage counts make that difference visible. These are all-size benchmarks, so the gaps also reflect the mix of homes.
| Borough | ZIP median / month | Tracked ZIPs |
|---|---|---|
| Manhattan | $4,768 | 44 |
| Brooklyn | $3,225 | 36 |
| Queens | $2,897 | 39 |
| Bronx | $2,852 | 19 |
| Staten Island | $2,549 | 10 |
Source: Zillow Research ZIP ZORI, September 2026–September 2026. Equal-weight median within each county: New York = Manhattan; Kings = Brooklyn; Richmond = Staten Island. Missing borough data would appear as n/a.
The $2,220 monthly gap between Manhattan and Staten Island is $26,634 over a year. That is a comparison of geographic benchmarks, not the savings for moving an identical apartment. Compare the commute, bedrooms, building access and recurring bills before treating the cheaper borough as the cheaper household budget.
Find a NYC ZIP rent benchmark
Use the table to narrow your search area. It reports the source month for every ZIP, because the stored observations do not all come from the same month. A ZIP is a postal area; it does not identify a single neighborhood or a uniform apartment market.
148 matching ZIP benchmarks. All unit sizes combined.
View ZIP rents and observation dates
| ZIP | Borough | Monthly index | Data month |
|---|---|---|---|
| 10001 | Manhattan | $5,592 | September 2026 |
| 10002 | Manhattan | $4,797 | September 2026 |
| 10003 | Manhattan | $5,229 | September 2026 |
| 10004 | Manhattan | $5,056 | September 2026 |
| 10005 | Manhattan | $4,739 | September 2026 |
| 10006 | Manhattan | $4,812 | September 2026 |
| 10007 | Manhattan | $8,183 | September 2026 |
| 10009 | Manhattan | $4,826 | September 2026 |
| 10010 | Manhattan | $5,286 | September 2026 |
| 10011 | Manhattan | $5,837 | September 2026 |
| 10012 | Manhattan | $5,287 | September 2026 |
| 10013 | Manhattan | $6,742 | September 2026 |
| 10014 | Manhattan | $6,017 | September 2026 |
| 10016 | Manhattan | $5,144 | September 2026 |
| 10017 | Manhattan | $4,489 | September 2026 |
| 10018 | Manhattan | $5,210 | September 2026 |
| 10019 | Manhattan | $4,850 | September 2026 |
| 10021 | Manhattan | $4,229 | September 2026 |
| 10022 | Manhattan | $5,053 | September 2026 |
| 10023 | Manhattan | $4,890 | September 2026 |
| 10024 | Manhattan | $4,649 | September 2026 |
| 10025 | Manhattan | $4,705 | September 2026 |
| 10026 | Manhattan | $3,506 | September 2026 |
| 10027 | Manhattan | $3,807 | September 2026 |
| 10028 | Manhattan | $3,968 | September 2026 |
| 10029 | Manhattan | $3,426 | September 2026 |
| 10030 | Manhattan | $3,072 | September 2026 |
| 10031 | Manhattan | $3,262 | September 2026 |
| 10032 | Manhattan | $3,011 | September 2026 |
| 10033 | Manhattan | $3,228 | September 2026 |
| 10034 | Manhattan | $2,610 | September 2026 |
| 10035 | Manhattan | $3,297 | September 2026 |
| 10036 | Manhattan | $4,739 | September 2026 |
| 10037 | Manhattan | $2,855 | September 2026 |
| 10038 | Manhattan | $5,048 | September 2026 |
| 10039 | Manhattan | $3,304 | September 2026 |
| 10040 | Manhattan | $2,955 | September 2026 |
| 10044 | Manhattan | $4,133 | September 2026 |
| 10065 | Manhattan | $5,067 | September 2026 |
| 10069 | Manhattan | $6,042 | September 2026 |
| 10075 | Manhattan | $4,004 | September 2026 |
| 10128 | Manhattan | $4,106 | September 2026 |
| 10280 | Manhattan | $4,989 | September 2026 |
| 10282 | Manhattan | $7,316 | September 2026 |
| 10301 | Staten Island | $2,634 | September 2026 |
| 10304 | Staten Island | $2,760 | September 2026 |
| 10305 | Staten Island | $2,485 | September 2026 |
| 10306 | Staten Island | $2,591 | September 2026 |
| 10307 | Staten Island | $2,214 | September 2026 |
| 10308 | Staten Island | $2,167 | September 2026 |
| 10309 | Staten Island | $2,121 | September 2026 |
| 10310 | Staten Island | $3,083 | September 2026 |
| 10312 | Staten Island | $2,582 | September 2026 |
| 10314 | Staten Island | $2,515 | September 2026 |
| 10451 | Bronx | $2,951 | September 2026 |
| 10452 | Bronx | $2,455 | September 2026 |
| 10453 | Bronx | $2,354 | September 2026 |
| 10454 | Bronx | $2,937 | September 2026 |
| 10455 | Bronx | $2,852 | September 2026 |
| 10456 | Bronx | $2,702 | September 2026 |
| 10457 | Bronx | $2,390 | September 2026 |
| 10458 | Bronx | $2,969 | September 2026 |
| 10460 | Bronx | $2,775 | September 2026 |
| 10461 | Bronx | $2,648 | September 2026 |
| 10462 | Bronx | $2,563 | September 2026 |
| 10463 | Bronx | $3,292 | September 2026 |
| 10465 | Bronx | $2,920 | September 2026 |
| 10466 | Bronx | $3,145 | September 2026 |
| 10467 | Bronx | $2,362 | September 2026 |
| 10468 | Bronx | $2,171 | September 2026 |
| 10469 | Bronx | $2,880 | September 2026 |
| 10471 | Bronx | $3,216 | September 2026 |
| 10473 | Bronx | $2,967 | September 2026 |
| 11101 | Queens | $4,347 | September 2026 |
| 11102 | Queens | $3,378 | September 2026 |
| 11103 | Queens | $3,268 | September 2026 |
| 11104 | Queens | $2,903 | September 2026 |
| 11105 | Queens | $3,178 | September 2026 |
| 11106 | Queens | $3,318 | September 2026 |
| 11109 | Queens | $4,490 | September 2026 |
| 11201 | Brooklyn | $4,717 | September 2026 |
| 11203 | Brooklyn | $2,825 | September 2026 |
| 11204 | Brooklyn | $2,592 | September 2026 |
| 11205 | Brooklyn | $4,062 | September 2026 |
| 11206 | Brooklyn | $4,066 | September 2026 |
| 11207 | Brooklyn | $3,286 | September 2026 |
| 11208 | Brooklyn | $3,383 | September 2026 |
| 11209 | Brooklyn | $2,868 | September 2026 |
| 11210 | Brooklyn | $2,939 | September 2026 |
| 11211 | Brooklyn | $4,935 | September 2026 |
| 11213 | Brooklyn | $3,110 | September 2026 |
| 11214 | Brooklyn | $2,780 | September 2026 |
| 11215 | Brooklyn | $4,260 | September 2026 |
| 11216 | Brooklyn | $3,590 | September 2026 |
| 11217 | Brooklyn | $4,332 | September 2026 |
| 11218 | Brooklyn | $3,156 | September 2026 |
| 11219 | Brooklyn | $2,874 | September 2026 |
| 11220 | Brooklyn | $2,914 | September 2026 |
| 11221 | Brooklyn | $3,608 | September 2026 |
| 11222 | Brooklyn | $4,836 | September 2026 |
| 11223 | Brooklyn | $2,525 | September 2026 |
| 11224 | Brooklyn | $3,377 | September 2026 |
| 11225 | Brooklyn | $3,362 | September 2026 |
| 11226 | Brooklyn | $3,052 | September 2026 |
| 11228 | Brooklyn | $3,090 | September 2026 |
| 11229 | Brooklyn | $2,622 | September 2026 |
| 11230 | Brooklyn | $2,754 | September 2026 |
| 11231 | Brooklyn | $4,575 | September 2026 |
| 11232 | Brooklyn | $3,164 | September 2026 |
| 11233 | Brooklyn | $3,301 | September 2026 |
| 11234 | Brooklyn | $2,677 | September 2026 |
| 11235 | Brooklyn | $2,614 | September 2026 |
| 11236 | Brooklyn | $2,919 | September 2026 |
| 11237 | Brooklyn | $3,778 | September 2026 |
| 11238 | Brooklyn | $4,222 | September 2026 |
| 11249 | Brooklyn | $5,792 | September 2026 |
| 11354 | Queens | $2,763 | September 2026 |
| 11355 | Queens | $2,735 | September 2026 |
| 11356 | Queens | $2,699 | September 2026 |
| 11357 | Queens | $3,030 | September 2026 |
| 11358 | Queens | $2,603 | September 2026 |
| 11360 | Queens | $3,042 | September 2026 |
| 11361 | Queens | $2,885 | September 2026 |
| 11364 | Queens | $2,814 | September 2026 |
| 11365 | Queens | $2,557 | September 2026 |
| 11366 | Queens | $2,425 | September 2026 |
| 11367 | Queens | $2,668 | September 2026 |
| 11370 | Queens | $2,897 | September 2026 |
| 11372 | Queens | $2,665 | September 2026 |
| 11373 | Queens | $2,751 | September 2026 |
| 11374 | Queens | $2,932 | September 2026 |
| 11375 | Queens | $3,204 | September 2026 |
| 11377 | Queens | $2,990 | September 2026 |
| 11378 | Queens | $2,782 | September 2026 |
| 11379 | Queens | $2,700 | September 2026 |
| 11385 | Queens | $3,438 | September 2026 |
| 11413 | Queens | $3,267 | September 2026 |
| 11414 | Queens | $2,775 | September 2026 |
| 11415 | Queens | $2,533 | September 2026 |
| 11418 | Queens | $2,594 | September 2026 |
| 11420 | Queens | $3,300 | September 2026 |
| 11423 | Queens | $2,644 | September 2026 |
| 11432 | Queens | $2,834 | September 2026 |
| 11433 | Queens | $2,965 | September 2026 |
| 11434 | Queens | $3,150 | September 2026 |
| 11435 | Queens | $2,422 | September 2026 |
| 11691 | Queens | $3,321 | September 2026 |
| 11692 | Queens | $3,110 | September 2026 |
Source: Zillow Research, stored ZIP observations. A missing ZIP is a coverage gap, not evidence of zero rent or no available apartments.
For a voucher search, compare the separate ZIP and bedroom rent lookup. For the existing city-level ZIP directory, see New York City rent estimates.
The advertised rent is only part of the budget
A free-month offer lowers the first-year average without necessarily lowering the regular monthly bill. Compare apartments using both numbers: the average cost over the lease and the amount due in a full-rent month. Keep electricity, gas, internet and any recurring building charges in separate lines so an included utility does not disappear from the comparison.
Compare the real monthly cost
A 12-month planning example. Change the assumptions to compare an offer; utilities are your estimate.
$3,083 / month averaged over year one
$2,933 net effective rent + $150 utilities. Budget for $3,350 in a full-rent month.
Formula: (monthly lease rent × paid months ÷ 12) + monthly utilities. Excludes deposits, moving costs and other fees. The lease determines when any concession applies.
Example: $3,200 lease, one free month
$2,933
Average rent / month in year one
Full-rent month, before utilities
$3,200
Cash needed for that month’s rent
Illustrative arithmetic: $3,200 × 11 ÷ 12 = $2,933.33, rounded. This is a hypothetical offer, not a current listing or a market average.
Set an income budget separately from approval criteria
If you choose to spend 30% of gross income on rent, a $3,000 monthly rent implies $120,000 in annual gross income: $3,000 × 12 ÷ 0.30. That is a planning scenario, not a universal landlord rule or a determination that the apartment is affordable for you. Debt, household size, benefits and other bills can change the result.
For move-in cash, list the first payment, any deposit, moving costs and setup charges separately from recurring expenses. Verify the written terms before paying. Comparing ownership? Use the rent versus buy calculator with the apartment’s actual rent and your ownership costs.
How to price a specific NYC apartment
The ZIP index is a starting point. To decide whether a listing is reasonably priced, build a small set of current, close matches and record what makes them comparable. For a landlord, the same exercise helps avoid underwriting a walk-up using elevator-building rents.
- Match the unit. Compare the same bedroom count, similar usable space, condition and outdoor space. Separate whole apartments from room rentals and furnished or short-term offers.
- Match daily use. Check the actual trip to work, building access, floor, elevator, laundry and included services. A nearby ZIP can be a poor substitute if those features differ.
- Normalize the lease. Record face rent, lease length, concessions and tenant-paid utilities. Compare the first lease and a scenario without the concession at renewal.
- Record dates and uncertainty. Keep the listing URL and observation date. An asking price is not a signed lease; a removed listing does not establish the final rent.
A one-bedroom and a two-bedroom should have separate comp sets. Our all-size data cannot support bedroom-specific averages, a recent growth rate, or a forecast. For an investment decision, carry a lower-rent scenario through the rental cash-flow calculator instead of assuming the highest comparable asking price will be achieved.
Market rent, existing leases and voucher limits answer different questions
ZORI is designed to measure market rents; existing tenants can have different lease terms and regulated rents. The City’s housing facts describe the occupied rental stock using a housing survey. Check the measure and observation year before comparing that survey with a current asking-rent benchmark.
For assisted housing, start with the Section 8 tools and the administering authority’s current schedule. A market index does not establish the adopted payment standard, utility allowance, tenant share or approved rent. For tenant protections, use NYC’s official tenant resources.
New York State rents: compare cities beyond NYC
The statewide median of 388 tracked ZIP benchmarks is $2,701. It combines NYC, suburbs and upstate markets. The table retains the city directory, ranked by ZIP coverage rather than affordability. Each city page shows its underlying ZIPs.
| City | ZIP median / month | ZIPs |
|---|---|---|
| New York | $3,128 | 148 |
| Buffalo | $1,380 | 23 |
| Rochester | $1,453 | 20 |
| Syracuse | $1,554 | 9 |
| Albany | $1,747 | 8 |
| Schenectady | $1,690 | 5 |
| White Plains | $3,203 | 5 |
| Yonkers | $2,746 | 5 |
| Niagara Falls | $1,206 | 4 |
| Binghamton | $1,335 | 3 |
For the purchase side, compare New York rental investment markets and the New York market directory. A lower rent does not by itself establish a stronger investment; purchase costs and operating expenses matter too.
Metro rent research
Read local rent trends, property strategies and acquisition downside analysis for each metro. Markets that span several states have one report.
- Syracuse metro · NY
Test contractor furnishing payback and the separate city/state lead-compliance budget before buying an older Syracuse rental.
- Buffalo metro · NY
Compare owner heating costs and per-student campus versus private housing obligations before pricing a rent premium.
- Rochester metro · NY
Compare academic and co-op paid room-months with annual household leases after utilities, furnishing and turnover costs.
Questions about average rent in NYC
What is the average rent in NYC?
The median of 148 tracked NYC ZIP rent indices is $3,128 per month; their arithmetic mean is $3,530. These equally weighted ZIP summaries cover all unit sizes and are not household-weighted citywide average rents. The latest observation is September 2026.
Is the New York State median the same as average rent in NYC?
No. The statewide median of tracked ZIP indices is $2,701. It includes locations outside the five boroughs. Use the NYC borough and ZIP comparisons for a city apartment search.
What is average rent for a one-bedroom or two-bedroom in NYC?
This dataset combines unit sizes, so it cannot establish separate one-bedroom or two-bedroom averages. Use current listings with the same bedroom count, similar space and location, then compare concessions and utility costs. Do not apply an all-size ZIP index as a bedroom-specific quote.
Does net effective rent equal the monthly payment?
Not necessarily. Net effective rent spreads concessions across the lease. A $3,200 monthly lease with one free month over 12 months averages $2,933 before utilities, but a full-rent month still costs $3,200. Read the lease for the actual payment schedule.
Can I use these rents as a Section 8 payment standard?
No. Zillow market rent indices, HUD Fair Market Rents and an authority’s adopted payment standards measure different things. Check the applicable housing authority, bedroom count, utility allowance and current schedule for a voucher search.
Read-only freshness audit, October 20, 2026: the shared database’s 388 eligible state ZIPs matched the upstream September 2026 observation month. No upstream ZIP was missing from storage and no matched stored observation lagged the source. Storage also held 122 older June–August observations outside the current sample; 121 stored ZIPs were absent from the downloaded file. These are dated audit counts, not a promise of future coverage. The lookup’s displayed dates and counts follow the shared validated refresh. Quarterly apartment research elsewhere on this page uses its own named sources, periods and cohorts.
Sources, geography and calculation methods
Primary rent source: Zillow Research housing data. ZORI is a smoothed measure of typical market rent. Zillow’s weighting applies within its index; our cross-ZIP aggregation gives each tracked ZIP equal weight. See Zillow’s ZORI methodology.
Our calculations: NYC includes only stored New York State ZIP rows assigned to New York, Kings, Queens, Bronx or Richmond County. We include positive finite rents. The median is the middle sorted ZIP value (or the mean of the middle pair); the mean is the sum divided by the number of ZIPs. Borough medians use the same method within each county. These summaries are not weighted by households, rental units or borough population.
Dates and gaps: NYC observations span September 2026 through September 2026; each ZIP’s month is shown in the table. Coverage is limited to ZIPs in our stored dataset. Different months and unit mixes limit comparisons. The ZIP lookup has no compatible bedroom history and does not calculate bedroom rents or ZIP growth. Separate apartment-market research above retains its own source cohorts and observation periods.
Statewide extremes: very high values in the stored New York data occur outside NYC, including the Hamptons. We do not present the statewide maximum as a usable NYC apartment budget, and we have not silently removed those values from the statewide median. An unusual value needs source and listing checks before use for a property.
Context sources: NYC housing facts and tenant resources. Links and methodology reviewed October 18, 2026. Market observation dates are separate from this editorial review.
Visuals: Michael Discenza’s January 2017 Manhattan photograph, source and license record, CC0; cropped for layout. Borough comparisons retain an accessible HTML table. Budget graphics and calculations are original RentalCalcs illustrations.
Revision: rebuilt the New York directory around five-borough comparisons, explicit ZIP weighting, source dates and a lease-cost comparison. About RentalCalcs · Report a data issue.