State rent research · editorial review 2026-10-24
Average Rent in Missouri: ZIPs, Occupancy Approval & First Rent
The median of 163 tracked Missouri ZIP rent indices is $1,401 per month for September 2026.
Equal weight per ZIP · all homes and bedrooms combined · derived from Zillow’s smoothed asking-rent indices; this ZIP series is not seasonally adjusted. This is not a provider-published statewide estimate, an average paid by tenants or a rent quote for a particular home.
St. Louis’s strong apartment occupancy is compatible with a slow first lease at a particular acquired unit. An inspection appointment, a certificate permitting occupancy and a tenant actually paying rent are separate milestones. In Kansas City, improving regional totals can still conceal different leasing competition north of the river, Downtown and in Lee’s Summit.
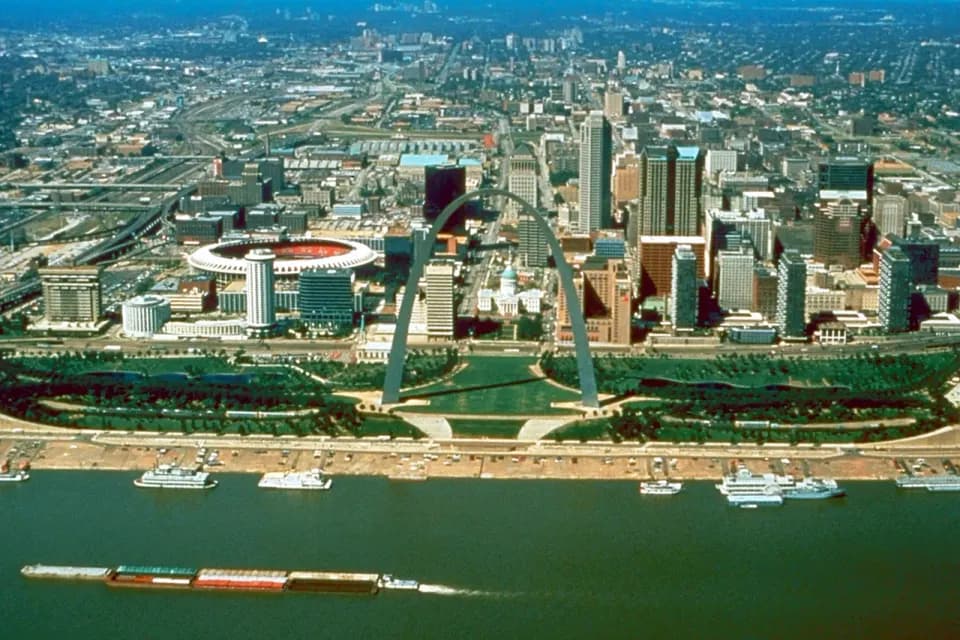
1994-09-01 · U.S. Army Corps of Engineers; individual photographer unspecified · Original photograph · Public domain. Resized and converted to WebP.

What the rent evidence changes for a rental decision
For a vacant St. Louis city acquisition, resolve the unit’s inspection/certificate file and fund required work before counting the first rent. Keep regional apartment evidence and Kansas City’s cross-state market separate from the actual Missouri parcel and directly competing buildings.
St. Louis regional apartments
Healthy occupancy can coexist with localized delivery pressure
Colliers’ October 19 Q3 report records 96.4% apartment occupancy and $1,457 effective monthly rent, with 2.1% annual growth. Quarterly absorption was 41 units against 108 deliveries; construction was concentrated in Central West End/Forest Park, St. Charles and Mid St. Louis County. This regional cohort includes Illinois submarkets and is not the Missouri ZIP benchmark.
Strong aggregate occupancy supports investigating retention, but weak quarterly absorption and concentrated supply make a blanket rent-reset assumption unconvincing. A small city rental competes with a specific set of units, not every apartment in the cross-river report.
Decision. Reconcile the subject’s signed renewals and collections to directly competing completed buildings. Keep effective and face rent separate. Review actual near-term openings before paying for a full-year higher rent or using the metro occupancy rate as the subject’s collection rate.
What could change it. A verified scarce layout with limited nearby openings can outperform the aggregate. Repeated incentives, tenant arrears or new competing supply can weaken it; one slow quarter alone does not establish a regional downturn.
Records to obtain. Signed leases and incentive addenda, collection aging, unit/service comparables and dated nearby construction/opening records.
Read the source reports
- Colliers St. Louis Q3 2026 multifamily report — Published October 19, 2026; Q3 apartment observations, including Illinois submarkets; read October 24, 2026.
City of St. Louis vacant rental acquisition
An inspection booking is not permission to start occupancy
The city says all its property is in a Housing Conservation District and requires a Certificate of Inspection before a rental unit is occupied. The ordinary vacant-unit application is $120. Its 3-business-day earliest / 15-day latest scheduling window concerns an inspection appointment, not a guaranteed completion or rent-start date.
A signed future lease cannot remove an unresolved inspection or repair condition. The city warns, “An inspection does not imply a guarantee or warranty” of the building or systems. A municipal minimum-code check and the buyer’s full condition assessment serve different purposes.
Decision. Obtain the unit’s current certificate, inspection report, permitted occupancy and open violations. Confirm reinspection requirements, utility readiness and bids before relying on a start date. If a certificate is issued with violations, confirm its occupancy conditions and repair deadline; do not assume every certificate means all work is complete. The figure assumes a vacant unit and excludes card-processing charges; actual fees and work can differ.
What could change it. A valid existing certificate and completed work may avoid the modeled delay or new application. Conversely, a failed inspection, expanded scope or contractor availability can extend it. St. Louis County and other cities have their own procedures.
Records to obtain. Parcel jurisdiction, certificate validity, open violations, unit/occupancy record, utility readiness, contractor bids and written approval conditions.
Read the source reports
- City of St. Louis residential occupancy / Housing Conservation inspection — Current city procedure read October 24, 2026; page identifies October 7, 2024 effective procedures; ordinary vacant-unit application $120.

2011-12-28 · Lasse Fuss · Original photograph · CC BY-SA 3.0. Resized and converted to WebP.

Kansas City regional apartments
Kansas City’s recovery is not uniform across the Missouri side
MMG’s Q3 2026 snapshot reports 92.8% occupancy and trailing-four-quarter absorption of 4,410 units versus 4,233 completions. Northmarq’s October 7 report describes an earlier Q2 picture: fewer than 100 units absorbed in the first half, with northern submarkets performing relatively better. Its second-half delivery pressure in Downtown and Lee’s Summit is an outlook. These different windows and provider cohorts are not a matched growth series.
The later-period regional improvement supports reviewing renewals, not applying a metro recovery premium everywhere. A Missouri-side Northland apartment and a Downtown lease-up can face different immediate competition. Johnson County or Overland Park evidence from the Kansas side is not a Missouri parcel comparison.
Decision. Identify nearby completed openings and signed renewal terms in the actual Missouri submarket. Separate Clay/Platte locations from Downtown and Lee’s Summit competition. Match unit class, services and lease incentives; retain a flat-rent case until collections support a change.
What could change it. A verified under-market lease or a scarce layout may support a stronger reset. New local supply, continuing incentives or weaker collections can defeat it even as metro totals recover. Confirm whether forecast projects actually opened before using them as current competition.
Records to obtain. Actual parcel/submarket, property class, signed leases and incentives, collection aging and dated completion/availability records for nearby buildings.
Read the source reports
- MMG Kansas City Q3 2026 public snapshot — Q3 2026 apartment snapshot; absorption/completions are trailing four quarters; publication date not displayed; retrieved October 24, 2026.
- Northmarq Kansas City Q2 2026 market insights — Published October 7, 2026; Q2 and first-half observations, separately identified second-half forecast; read October 24, 2026.
Hypothetical vacant St. Louis city unit · $120 ordinary application + $2,500 initial repair bid · 0, 1 or 2 additional unavailable months · not a forecast of city processing time
- Inspect the actual unitApplication/payment and a booked appointment do not establish approval.
- Obtain the required certificate; confirm its conditionsVerify validity, permitted occupancy, any repair deadlines and the written file before occupancy.
- Occupy, then collect under the actual leaseTenant payment is another milestone; an appointment is not a rent guarantee.
Initial application + assumed work · $2,620
Rent removed · $0
First-year cash · −$2,160
Rent removed · $1,330
First-year cash · −$3,490
Rent removed · $2,660
First-year cash · −$4,820
The three cases vary income timing after the same assumed work. They are not estimates of the city’s processing time. Annual carrying costs remain in the budget once.
| Measure | Value | Definition |
|---|---|---|
| Ordinary vacant-unit application | 120 | $120 published application; hypothetical payment without a card surcharge. Other circumstances can cost more. |
| Initial repair assumption | 2,500 | $2,500 owner cash before occupancy; not a city estimate, recurring expense or replacement reserve. |
| Owner cash before first occupancy | 2,620 | $2,620 application/work only; finance and operating carrying costs remain in the annual budget. |
| Annual cash after those costs, no extra delay | -2,160 | $460 recurring annual cash less $2,620 initial uses = −$2,160. |
| Annual cash with one extra unavailable month | -3,490 | One occupied-share month removes another $1,330; cash becomes −$3,490. |
| Annual cash with two extra unavailable months | -4,820 | Two additional months remove $2,660 once; combined cash becomes −$4,820. |
Read the approval path before the income cases: inspect → obtain the required certificate and confirm its conditions → permit occupancy → collect under the actual lease. The three delay cases are sensitivities, not city turnaround promises. With $2,500 work assumed, even the zero-delay first year is negative; removing delay alone does not make the acquisition fund itself. The annual model already includes carrying costs, so do not add the same monthly debt or operating allocation again.
Read the source reports
- City of St. Louis residential occupancy / Housing Conservation inspection — Current city procedure read October 24, 2026; page identifies October 7, 2024 effective procedures; ordinary vacant-unit application $120.
Compare rents across these county groups
St. Louis city is independent of St. Louis County. The source’s city label is retained separately; municipal inspection rules are applied to the actual parcel. Kansas City and St. Louis publisher metros include other states, while these county sets contain only the listed Missouri observations.
These analyst-selected sets use the listed county labels and the same September 2026 observation month. Each ZIP receives one equal vote. They are not official metro definitions, exhaustive regions or bedroom comparisons.
32 distinct county labels appear in the current sample; geographic coverage is incomplete and uneven. Only currently available observations from the same latest month enter these comparisons. Older retained records and missing ZIPs do not enter as zero rents.
| Comparison and exact membership | ZIP median | ZIP count |
|---|---|---|
| St. Louis independent city Saint Louis City | $1,293 | 15 |
| St. Louis County Saint Louis | $1,495 | 33 |
| St. Charles / Jefferson / Franklin set Saint Charles, Jefferson, Franklin | $1,716 | 12 |
| Kansas City Missouri-side set Jackson, Clay, Platte, Cass | $1,514 | 56 |
| Springfield-area county set Greene, Christian, Webster | $1,314 | 11 |
| Columbia / Jefferson City set Boone, Cole, Callaway | $1,364 | 5 |
Compare supported postal-city groups
City links require at least three current ZIP observations. Postal city labels are not legal municipal boundaries. Groups are ordered by coverage, then name; this is not an affordability ranking.
9 matching cities
| Postal city | ZIP median / month | ZIP mean / month | ZIP count |
|---|---|---|---|
| Kansas City | $1,463 | $1,459 | 29 |
| Saint Louis | $1,293 | $1,274 | 15 |
| Independence | $1,328 | $1,333 | 6 |
| Springfield | $1,169 | $1,194 | 6 |
| Lees Summit | $1,696 | $1,668 | 5 |
| Saint Joseph | $1,113 | $1,108 | 4 |
| Columbia | $1,374 | $1,443 | 3 |
| Florissant | $1,656 | $1,800 | 3 |
Show 1 more city groups
| Postal city | ZIP median / month | ZIP mean / month | ZIP count |
|---|---|---|---|
| Saint Charles | $1,591 | $1,538 | 3 |
Find a ZIP rent observation
The table preserves each source ZIP, date and supplied county label. A ZIP can cross county or municipal boundaries; verify the actual address separately. No bedroom multiplier is applied.
163 matching ZIPs
| ZIP | Postal city | County label | Index / month | Observation |
|---|---|---|---|---|
| 63005 | Chesterfield | Saint Louis County | $1,747 | September 2026 |
| 63010 | Arnold | Jefferson County | $1,816 | September 2026 |
| 63011 | Ballwin | Saint Louis County | $2,129 | September 2026 |
| 63017 | Chesterfield | Saint Louis County | $1,660 | September 2026 |
| 63021 | Ballwin | Saint Louis County | $1,613 | September 2026 |
| 63026 | Fenton | Jefferson County | $1,539 | September 2026 |
| 63031 | Florissant | Saint Louis County | $1,569 | September 2026 |
| 63033 | Florissant | Saint Louis County | $1,656 | September 2026 |
| 63034 | Florissant | Saint Louis County | $2,176 | September 2026 |
| 63042 | Hazelwood | Saint Louis County | $1,503 | September 2026 |
Show 153 more ZIP observations
| ZIP | Postal city | County label | Index / month | Observation |
|---|---|---|---|---|
| 63043 | Maryland Heights | Saint Louis County | $1,495 | September 2026 |
| 63049 | High Ridge | Jefferson County | $919 | September 2026 |
| 63052 | Imperial | Jefferson County | $1,795 | September 2026 |
| 63074 | Saint Ann | Saint Louis County | $1,314 | September 2026 |
| 63101 | Saint Louis | Saint Louis City | $1,329 | September 2026 |
| 63102 | Saint Louis | Saint Louis City | $1,901 | September 2026 |
| 63103 | Saint Louis | Saint Louis City | $1,437 | September 2026 |
| 63104 | Saint Louis | Saint Louis City | $1,423 | September 2026 |
| 63105 | Clayton | Saint Louis County | $1,649 | September 2026 |
| 63108 | Saint Louis | Saint Louis City | $1,664 | September 2026 |
| 63109 | Saint Louis | Saint Louis City | $1,136 | September 2026 |
| 63110 | Saint Louis | Saint Louis City | $1,476 | September 2026 |
| 63111 | Saint Louis | Saint Louis City | $1,033 | September 2026 |
| 63112 | Saint Louis | Saint Louis City | $1,293 | September 2026 |
| 63113 | Saint Louis | Saint Louis City | $961 | September 2026 |
| 63114 | Overland | Saint Louis County | $1,235 | September 2026 |
| 63115 | Saint Louis | Saint Louis City | $952 | September 2026 |
| 63116 | Saint Louis | Saint Louis City | $1,093 | September 2026 |
| 63117 | Richmond Heights | Saint Louis County | $1,495 | September 2026 |
| 63118 | Saint Louis | Saint Louis City | $1,186 | September 2026 |
| 63119 | Webster Groves | Saint Louis County | $1,816 | September 2026 |
| 63121 | Normandy | Saint Louis County | $1,173 | September 2026 |
| 63122 | Kirkwood | Saint Louis County | $1,981 | September 2026 |
| 63123 | Affton | Saint Louis County | $1,452 | September 2026 |
| 63124 | Ladue | Saint Louis County | $2,542 | September 2026 |
| 63125 | Lemay | Saint Louis County | $1,238 | September 2026 |
| 63126 | Crestwood | Saint Louis County | $2,166 | September 2026 |
| 63128 | Concord | Saint Louis County | $1,408 | September 2026 |
| 63129 | Oakville | Saint Louis County | $1,485 | September 2026 |
| 63130 | University City | Saint Louis County | $1,519 | September 2026 |
| 63132 | Olivette | Saint Louis County | $1,480 | September 2026 |
| 63134 | Berkeley | Saint Louis County | $1,331 | September 2026 |
| 63135 | Ferguson | Saint Louis County | $1,401 | September 2026 |
| 63136 | Jennings | Saint Louis County | $1,291 | September 2026 |
| 63137 | Riverview | Saint Louis County | $1,353 | September 2026 |
| 63138 | Spanish Lake | Saint Louis County | $1,249 | September 2026 |
| 63139 | Saint Louis | Saint Louis City | $1,305 | September 2026 |
| 63141 | Creve Coeur | Saint Louis County | $1,452 | September 2026 |
| 63143 | Maplewood | Saint Louis County | $1,227 | September 2026 |
| 63144 | Brentwood | Saint Louis County | $1,826 | September 2026 |
| 63146 | Maryland Heights | Saint Louis County | $1,370 | September 2026 |
| 63147 | Saint Louis | Saint Louis City | $925 | September 2026 |
| 63301 | Saint Charles | Saint Charles County | $1,328 | September 2026 |
| 63303 | Saint Charles | Saint Charles County | $1,591 | September 2026 |
| 63304 | Saint Charles | Saint Charles County | $1,696 | September 2026 |
| 63366 | O Fallon | Saint Charles County | $1,708 | September 2026 |
| 63367 | Lake Saint Louis | Saint Charles County | $1,944 | September 2026 |
| 63368 | O Fallon | Saint Charles County | $1,725 | September 2026 |
| 63376 | Saint Peters | Saint Charles County | $1,723 | September 2026 |
| 63379 | Troy | Lincoln County | $1,353 | September 2026 |
| 63383 | Warrenton | Warren County | $1,317 | September 2026 |
| 63385 | Wentzville | Saint Charles County | $1,854 | September 2026 |
| 63501 | Kirksville | Adair County | $808 | September 2026 |
| 63640 | Farmington | Saint Francois County | $1,261 | September 2026 |
| 63701 | Cape Girardeau | Cape Girardeau County | $931 | September 2026 |
| 63755 | Jackson | Cape Girardeau County | $1,175 | September 2026 |
| 63801 | Sikeston | Scott County | $1,213 | September 2026 |
| 64012 | Belton | Cass County | $1,728 | September 2026 |
| 64014 | Blue Springs | Jackson County | $1,721 | September 2026 |
| 64015 | Blue Springs | Jackson County | $1,689 | September 2026 |
| 64024 | Excelsior Springs | Clay County | $1,391 | September 2026 |
| 64029 | Grain Valley | Jackson County | $1,732 | September 2026 |
| 64030 | Grandview | Jackson County | $1,357 | September 2026 |
| 64050 | Independence | Jackson County | $1,201 | September 2026 |
| 64052 | Independence | Jackson County | $1,162 | September 2026 |
| 64053 | Independence | Jackson County | $1,020 | September 2026 |
| 64055 | Independence | Jackson County | $1,454 | September 2026 |
| 64056 | Independence | Jackson County | $1,634 | September 2026 |
| 64057 | Independence | Jackson County | $1,527 | September 2026 |
| 64063 | Lees Summit | Jackson County | $1,574 | September 2026 |
| 64064 | Lees Summit | Jackson County | $1,749 | September 2026 |
| 64068 | Liberty | Clay County | $1,574 | September 2026 |
| 64079 | Platte City | Platte County | $1,753 | September 2026 |
| 64080 | Pleasant Hill | Cass County | $1,636 | September 2026 |
| 64081 | Lees Summit | Jackson County | $1,788 | September 2026 |
| 64082 | Lees Summit | Jackson County | $1,696 | September 2026 |
| 64083 | Raymore | Cass County | $1,742 | September 2026 |
| 64086 | Lees Summit | Jackson County | $1,531 | September 2026 |
| 64093 | Warrensburg | Johnson County | $1,093 | September 2026 |
| 64101 | Kansas City | Jackson County | $1,171 | September 2026 |
| 64105 | Kansas City | Jackson County | $1,449 | September 2026 |
| 64106 | Kansas City | Jackson County | $1,780 | September 2026 |
| 64108 | Kansas City | Jackson County | $1,570 | September 2026 |
| 64109 | Kansas City | Jackson County | $1,214 | September 2026 |
| 64110 | Kansas City | Jackson County | $1,421 | September 2026 |
| 64111 | Kansas City | Jackson County | $1,308 | September 2026 |
| 64112 | Kansas City | Jackson County | $1,463 | September 2026 |
| 64114 | Kansas City | Jackson County | $1,526 | September 2026 |
| 64116 | Kansas City | Clay County | $1,471 | September 2026 |
| 64117 | Kansas City | Clay County | $1,182 | September 2026 |
| 64118 | Gladstone | Clay County | $1,311 | September 2026 |
| 64119 | Kansas City | Clay County | $1,677 | September 2026 |
| 64120 | Kansas City | Jackson County | $1,513 | September 2026 |
| 64123 | Kansas City | Jackson County | $1,292 | September 2026 |
| 64124 | Kansas City | Jackson County | $1,211 | September 2026 |
| 64127 | Kansas City | Jackson County | $1,384 | September 2026 |
| 64128 | Kansas City | Jackson County | $1,266 | September 2026 |
| 64129 | Kansas City | Jackson County | $1,128 | September 2026 |
| 64130 | Kansas City | Jackson County | $1,348 | September 2026 |
| 64131 | Kansas City | Jackson County | $1,226 | September 2026 |
| 64132 | Kansas City | Jackson County | $1,246 | September 2026 |
| 64133 | Raytown | Jackson County | $1,269 | September 2026 |
| 64134 | Kansas City | Jackson County | $1,467 | September 2026 |
| 64137 | Kansas City | Jackson County | $1,603 | September 2026 |
| 64138 | Raytown | Jackson County | $1,599 | September 2026 |
| 64150 | Riverside | Platte County | $1,994 | September 2026 |
| 64151 | Kansas City | Platte County | $1,492 | September 2026 |
| 64152 | Parkville | Platte County | $1,850 | September 2026 |
| 64153 | Kansas City | Platte County | $1,573 | September 2026 |
| 64154 | Kansas City | Platte County | $1,563 | September 2026 |
| 64155 | Kansas City | Clay County | $1,805 | September 2026 |
| 64157 | Kansas City | Clay County | $2,459 | September 2026 |
| 64158 | Kansas City | Clay County | $1,515 | September 2026 |
| 64503 | Saint Joseph | Buchanan County | $1,048 | September 2026 |
| 64504 | Saint Joseph | Buchanan County | $1,200 | September 2026 |
| 64506 | Saint Joseph | Buchanan County | $1,007 | September 2026 |
| 64507 | Saint Joseph | Buchanan County | $1,178 | September 2026 |
| 64701 | Harrisonville | Cass County | $1,312 | September 2026 |
| 64801 | Joplin | Jasper County | $983 | September 2026 |
| 64804 | Joplin | Newton County | $1,348 | September 2026 |
| 64834 | Carl Junction | Jasper County | $1,500 | September 2026 |
| 64836 | Carthage | Jasper County | $1,175 | September 2026 |
| 64850 | Neosho | Newton County | $1,180 | September 2026 |
| 64870 | Webb City | Jasper County | $1,184 | September 2026 |
| 65020 | Camdenton | Camden County | $1,325 | September 2026 |
| 65026 | Eldon | Miller County | $1,008 | September 2026 |
| 65049 | Lake Ozark | Camden County | $1,716 | September 2026 |
| 65065 | Osage Beach | Camden County | $1,625 | September 2026 |
| 65101 | Jefferson City | Cole County | $971 | September 2026 |
| 65109 | Jefferson City | Cole County | $1,079 | September 2026 |
| 65201 | Columbia | Boone County | $1,590 | September 2026 |
| 65202 | Columbia | Boone County | $1,364 | September 2026 |
| 65203 | Columbia | Boone County | $1,374 | September 2026 |
| 65233 | Boonville | Cooper County | $800 | September 2026 |
| 65301 | Sedalia | Pettis County | $1,147 | September 2026 |
| 65336 | Knob Noster | Johnson County | $1,128 | September 2026 |
| 65401 | Rolla | Phelps County | $824 | September 2026 |
| 65536 | Lebanon | Laclede County | $981 | September 2026 |
| 65583 | Waynesville | Pulaski County | $1,320 | September 2026 |
| 65584 | Saint Robert | Pulaski County | $1,206 | September 2026 |
| 65613 | Bolivar | Polk County | $1,002 | September 2026 |
| 65616 | Branson | Taney County | $1,364 | September 2026 |
| 65619 | Battlefield | Greene County | $1,538 | September 2026 |
| 65706 | Marshfield | Webster County | $1,244 | September 2026 |
| 65714 | Nixa | Christian County | $1,545 | September 2026 |
| 65721 | Ozark | Christian County | $1,566 | September 2026 |
| 65738 | Republic | Greene County | $1,393 | September 2026 |
| 65802 | Springfield | Greene County | $1,105 | September 2026 |
| 65803 | Springfield | Greene County | $1,071 | September 2026 |
| 65804 | Springfield | Greene County | $1,314 | September 2026 |
| 65806 | Springfield | Greene County | $978 | September 2026 |
| 65807 | Springfield | Greene County | $1,233 | September 2026 |
| 65810 | Springfield | Greene County | $1,461 | September 2026 |
Can the first lease repay initial approval and repair cash?
Hypothetical unit: $1,400 rent, 5% baseline vacancy/noncollection, no free month, $6,000 annual operating costs, $8,500 debt and $1,000 reserves. Initial $120 application and $2,500 work are separate, not inside these annual expenses. The rent is an assumption, not the regional effective-rent observation or a city quote.
Initial calculated result: $15,960 collected rent, $9,960 NOI before debt/reserves, and $460 cash after debt/reserves. Change the assumptions below to test your own budget.
Illustration · one apartment · first 12 months · USD. Editable assumptions, not observed market averages or an acquisition recommendation. All recurring amounts are allocated per apartment. No appreciation, sale proceeds or tax benefits are assumed.
Annual cash after operating costs, debt and reserve contribution
$460This is a positive illustration margin, before initial capital work, income tax and sale costs.
- Scheduled rent
- $16,800
- − Vacancy / noncollection
- -$840
- − Occupied-share concession
- -$0
- = Effective rental income
- $15,960
- − Operating expenses
- -$6,000
- = NOI before debt / reserves
- $9,960
- − Debt service
- -$8,500
- − Reserve contribution
- -$1,000
- = Annual cash margin
- $460
NOI excludes debt service and this worksheet’s reserve contribution. Initial renovation, acquisition costs and initial downtime are outside this annual operating illustration. Do not subtract the same vacancy, incentive or repair expense twice.
On a narrow screen, scroll the table sideways to compare all three expense budgets.
| Collected occupancy | Entered expenses | Expenses +10% | Expenses +20% |
|---|---|---|---|
| 95% | $460Cash remaining | -$140Cash deficit | -$740Cash deficit |
| 90% | -$380Cash deficit | -$980Cash deficit | -$1,580Cash deficit |
| 85% | -$1,220Cash deficit | -$1,820Cash deficit | -$2,420Cash deficit |
Occupancy here is the collected share of scheduled rent before incentives, not a count of occupied doors. At the entered costs, break-even collected occupancy is 92.3%. Debt-service coverage is 1.17× NOI / debt service; it excludes reserve contributions.
Recurring annual cash is $460. First-year cash after assumed approval/work is −$2,160 even without additional delay. Set one free/unavailable month to test −$870 recurring cash, then subtract the separate $2,620 once for −$3,490. A valid existing certificate or a smaller actual bid changes this result; a lender or city appointment does not guarantee it.
Use the full property cash-flow calculator for the purchase price, financing terms and holding period. Review its expense and reserve conventions before transferring assumptions; this illustration does not automatically populate a deal.
Missouri rent questions
Is this Missouri’s average rent paid by tenants?
No. The benchmark is the equal-ZIP median of current all-home/all-bedroom asking-rent indices, smoothed and not seasonally adjusted. It is not a household-weighted paid rent, bedroom estimate or provider-published state series.
Does St. Louis metro occupancy apply to my city unit?
No. The publisher’s regional apartment sample includes Illinois and differs from a particular property’s tenancy, collections and readiness. Verify signed comparables and the actual parcel’s certificate records.
Does the St. Louis inspection scheduling window guarantee first rent?
No. Scheduling, the required certificate, permitted occupancy and tenant payment are separate milestones. The figure’s delay months are hypothetical; existing validity, work scope and actual procedure control.
Is Kansas City’s whole metro in Missouri?
No. The regional market extends into Kansas. These county comparison sets use only the named Missouri counties; taxes, municipal duties and financing need property-specific verification.
How these rent figures are calculated
State: Missouri · USPS MO · Census state FIPS 29. Zillow supplies postal ZIP observations with city and county labels. We filter to valid positive rents in this state and the latest common observation month, sort the values, and take the middle value, or the mean of the two middle values for an even count. Means are the sum divided by included ZIPs. No population, household or rental-unit weighting is added.
The all-home, all-bedroom ZIP series is smoothed, not seasonally adjusted. A bedroom rent cannot be inferred from it. Membership can change after a refresh, so a change in this page’s median is not a matched-sample rent-growth rate. This edition does not publish a ZIP-sample growth claim.
Data: Zillow Research · ZORI method · National ZIP source CSV. The state benchmark is our ZIP-based calculation, not a provider-published statewide estimate. Occupied-unit Census rent, listing medians, effective broker rents and HUD gross-rent references answer different questions and are not blended here.
The observation month identifies the rent data available for this comparison. Historical or missing latest observations stay out of the current sample. Check the date before comparing a property with a newly advertised offer.
Market and legal sources below were reviewed 2026-10-24. Their own periods are shown next to each claim. Broker samples and boundaries are not fully disclosed; surveys may share underlying providers and should not be treated as independent experiments. The market interpretation is conditional research, not a property-level income guarantee. Recheck local rules, signed comparable leases and actual expenses before using an illustration in a transaction.
Read the source reports
- Colliers St. Louis Q3 2026 multifamily report — Published October 19, 2026; Q3 apartment observations, including Illinois submarkets; read October 24, 2026.
- City of St. Louis residential occupancy / Housing Conservation inspection — Current city procedure read October 24, 2026; page identifies October 7, 2024 effective procedures; ordinary vacant-unit application $120.
- MMG Kansas City Q3 2026 public snapshot — Q3 2026 apartment snapshot; absorption/completions are trailing four quarters; publication date not displayed; retrieved October 24, 2026.
- Northmarq Kansas City Q2 2026 market insights — Published October 7, 2026; Q2 and first-half observations, separately identified second-half forecast; read October 24, 2026.