Good cash flow has to do three jobs: pay the owner enough, justify the cash committed and leave the property able to absorb trouble. A dollar-per-door rule answers none of those questions on its own.
In the hypothetical house below, about $300 a month after debt and a capital reserve produces a 5.3% cash yield on $68,000 committed. That misses an owner's illustrative $400 monthly income goal. An additional $3,000 repair reduces the year's cash to about $600. The same deal can pass a positive-cash-flow test and fail the buyer's actual requirements.
Define the cash you can spend
For this guide, spendable pre-tax cash is collected rental income minus operating bills, the full principal-and-interest payment and money set aside for capital replacements. It excludes appreciation, sale proceeds and income-tax effects. An annual allowance is a planning tool; it is not a promise of equal deposits every month.
Keep NOI separate. A building can earn positive operating income before financing and still leave its owner short after the mortgage. A funded replacement reserve is also different from a bill already paid: do not subtract the same roof purchase and reserve transfer twice when reconciling actual cash.
Why a per-door target is incomplete
At $100 a month, a property generates $1,200 a year. That is 6.0% on $20,000 committed, but 1.2% on $100,000. Neither percentage alone says whether the price, work or risk is acceptable. A property with a roof due soon also needs more near-term liquidity than an otherwise comparable property with a funded replacement plan.
Use cash-on-cash return to connect cash income to acquisition cash. JLL's real-estate glossary describes the metric as annual pre-tax cash flow relative to cash invested. It is a cash-yield measure, not a complete investment return or a national pass/fail benchmark.
No property-type or city label supplies a reliable universal cash-flow target. For a duplex, show both the building total and the per-unit figure. Dividing a building's $200 monthly cash by two units produces $100 per door, not $400.
One house, one complete budget
This illustration uses a $200,000 purchase, $50,000 down and a $150,000 loan amortized over 30 years at an assumed 7%. The rate is a modeling input, not a current quote. Initial cash is $68,000: down payment, $6,000 closing costs, $6,000 immediate work and $6,000 cash held back. Closing costs include prepaid items; the operating budget still shows a full year's expenses.
Monthly scheduled rent is $2,200. The 5% vacancy-and-collection allowance and 10% management charge on collected rent are assumptions. Repairs are $1,500, taxes $2,400, insurance $1,300 and other annual operating costs $300. A separate $1,500 capital reserve completes the budget.
Preview: 2 of 7 rows
| Annual budget | Dollars |
|---|---|
| Scheduled rent | $26,400 |
| Vacancy and collection allowance | -$1,320 |
| Collected income | $25,080 |
| Operating expenses, including management | -$8,008 |
| Capital reserve | -$1,500 |
| Principal and interest | -$11,975 |
| Cash available to the owner | $3,597 |
The result is about $300 a month and a 5.3% cash yield. Calculations use the unrounded loan payment; table dollars are rounded. The 50% expense-rule guide explains why a shortcut gives a different answer for this same house.
The held-back $6,000 is included in acquisition cash because it is committed to the property. It is not another annual expense. If part of it later pays a bill, record the actual bill and reconcile the reserve balance rather than treating the transfer itself as new profit or a second expense.
Turn an income goal into a dollar test
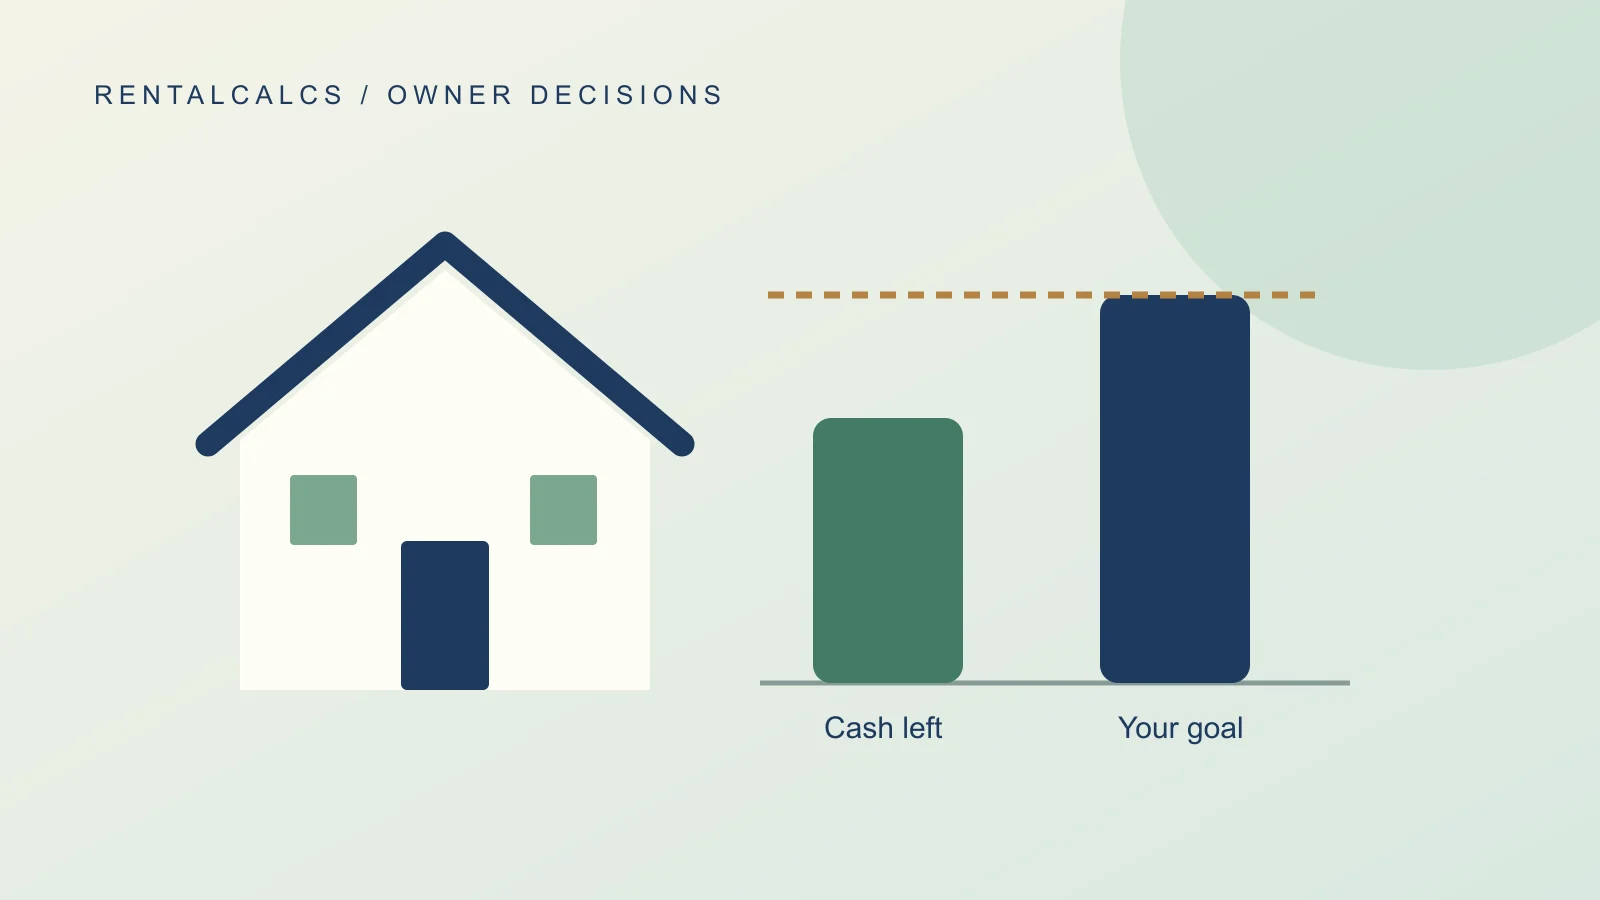
Suppose this buyer needs $400 a month from this property. That requires $4,800 annually, equivalent to a 7.1% cash yield on $68,000. The modeled shortfall is about $1,203 a year, or $100 a month.
That is a useful negotiating or screening requirement because it identifies the missing dollars. It does not establish that 7.1% is a suitable return for another buyer. A different acquisition cash total changes the required percentage even when the income goal stays the same.
Test the decision
Does the cash meet your income goal?
Hypothetical illustration, reviewed October 8, 2026. Use annual cash after debt and reserves, before income tax. Starting cash is rounded from the worked house. The downside replaces the 5% vacancy allowance with one empty month and adds a $3,000 repair. The goal is your assumption, not a recommended return.
Annual cash above / below your goal
-$1,203
5.3% modeled cash yield; 7.1% needed for this goal.
Annual cash$3,597
Annual goal$4,800
Original RentalCalcs calculation; bar lengths show dollar magnitude. Red means a negative value. Figures are rounded for display.
- Annual income goal
- $4,800
- Cash above / below goal
- -$1,203
- Modeled cash yield
- 5.3%
- Yield needed for your goal
- 7.1%
Free to use without an account. This illustration does not save a deal.
If you change the purchase price, rerun the loan, down payment and closing cash together. Cutting the mortgage payment while leaving the initial-cash denominator unchanged creates a mismatched comparison. Likewise, a proposed rent increase needs lease and market support; it is not income already earned.
Test the year when the average fails
An annual average can hide the month when several bills arrive. Three simple cases show the difference between a thin margin and a durable plan:
| Year tested | Annual cash after reserve and debt |
|---|---|
| Base illustration | $3,597 |
| Additional $3,000 repair beyond the budget | $597 |
| One full vacant month, replacing the 5% allowance, plus that repair | -$195 |
In the last case, actual missed rent is $2,200 rather than the budgeted $1,320. The extra $880 loss also reduces the assumed management fee by $88, leaving $792 less cash before the repair. This replaces the original vacancy allowance; it does not stack a full empty month on top of the same loss twice.
The initial $6,000 buffer could cover the illustrated $195 annual deficit, but timing still matters. A January repair cannot be paid with cash expected in December. List starting cash, bill due dates and any insurance deductible before deciding how much to distribute. The insurance budgeting guide tests that separate cash demand.
Compare the cost of doing the work
Self-management may increase cash retained by the owner, but it also adds work. Show both the actual cash budget and a comparison with paid management. Keep the owner's assigned hourly value outside cash expenses unless money is actually being paid.
Our management comparison separates paid fees, self-management spending and hours saved. It also includes leasing charges rather than assuming the monthly percentage is the whole contract. A lower-fee option can be attractive without being operationally workable for a distant owner.
Decide what must change before buying
For this hypothetical buyer, the base house misses the $400 monthly goal and turns slightly negative in the combined repair/vacancy case. The buyer needs a documented change in price, financing, income or cost, a different income goal, or a different property. Assumed appreciation does not close this cash shortfall.
Use the Single Family Calculator for the complete one-to-four-unit analysis; use the multifamily calculator for larger buildings. Enter supported rents, buyer-specific taxes, an insurance quote and the full management contract. Then compare the annual cash, cash required and downside on the same assumptions. The free worksheet above keeps the goal and evidence together without requiring an account.
Get new articles and market updates
Investing guides and market data, straight to your inbox. Unsubscribe anytime.