Florida apartment cap-rate evidence
Q2 2026 public reports show a 5.3% South Florida cap benchmark from Colliers, 5.61% in Tampa and 5.57% in Jacksonville from Matthews. Orlando’s verified 5.0–5.5% range is older, from Northmarq’s Q4 2025 report. These different publisher series do not form a Florida average or a neighborhood pricing curve.
Cap rate is annual net operating income (NOI) divided by price, before financing. The right comparison starts with the property type, legal income, observation period and source method. There is no defensible statewide average in this edition.
Q2 2026
Q2 2026
Q2 2026
Q4 2025
| Geography / source | Cap / comparison | Period / statistic | Coverage boundary |
|---|---|---|---|
| South Florida Colliers — South Florida Q2 2026 | 5.30% | Q2 2026 Published regional cap benchmark | Regional blend; not a separate Miami, Broward or Palm Beach cap. |
| Tampa Matthews — Tampa Q2 2026 | 5.61% | Q2 2026 Publisher-reported cap series; sale/market basis not fully disclosed | No disclosed cap sample, weighting or NOI convention. |
| Jacksonville Matthews — Jacksonville Q2 2026 | 5.57% -5 bps vs 5.62% | Q2 2026 vs Q2 2025 Publisher-reported cap series; sale/market basis not fully disclosed | Five-bp annual move is not a matched-property change. |
| Orlando — older cap evidence Northmarq — Orlando Q4 2025 | 5.00–5.50% | Q4 2025 Approximate average transaction range | Older than Q2 operating evidence; not relabeled 2026. |
Matthews’ public summaries do not fully establish whether the cap is a sale-only average or broader market series. Keep that uncertainty with the figures. Colliers and Northmarq also do not disclose cap-reporting counts, weighting or a harmonized NOI convention in these summaries. Regional composites, point benchmarks and a range answer different questions; no ranking or statewide average is calculated. One percentage point equals 100 basis points. No incompatible series are averaged.
The underwriting implication: A shrinking pipeline is a reason to investigate recovery, not permission to erase concessions. Buyer insurance, the post-acquisition tax basis and current competition can consume the NOI improvement before a lower cap becomes plausible.
What the evidence changes locally
| Geography / period | Measure / value | Basis and limits |
|---|---|---|
| Miami Q2 2026 | Occupancy / effective monthly rent 94.6% / $2,380 | MMG; rent −0.2% YoY, 15,481 units under construction MMG — Miami Q2 2026 |
| Tampa Q2 2026 | Vacancy / reported monthly rent 5.65% / $1,791 | Matthews; vacancy +84 bps YoY, rent −3.16% YoY; rent definition not harmonized with MMG Matthews — Tampa Q2 2026 |
| Jacksonville Q2 2026 | Occupancy / effective monthly rent 90.7% / $1,423 | MMG; rent −0.5% YoY; separate from Matthews rent-growth series MMG — Jacksonville Q2 2026 |
| Orlando Q2 2026 | Occupancy / effective monthly rent 92.5% / $1,691 | MMG; rent −2.7% YoY; cap evidence remains Q4 2025 MMG — Orlando Q2 2026 |
Miami-Dade, Broward and Palm Beach: regional stability does not eliminate lease-up risk
Observed evidence. Colliers reports a 5.3% regional cap for the third consecutive quarter in Q2 2026 and $1.3 billion of quarterly transactions. Separately, MMG’s Miami Q2 operating summary shows 94.6% occupancy, $2,380 effective monthly rent and a 0.2% annual rent decline, with 15,481 units under construction.
A regional investment average combines different counties, buildings and buyer pools. Miami’s continuing pipeline can compete with a subject building even when regional transaction yields look stable. Coastal coverage terms and replacement costs also differ from inland properties.
RentalCalcs interpretation. Stabilization is better supported than automatic compression: absorption is approaching deliveries in Miami, but annual effective rent remains soft. Selective compression needs evidence that collected income grows after concessions and that buyer cost quotes preserve the margin.
What would change the view. The same MMG summary describes two sequential quarters of rent gains. Sustained gains after competing projects open would improve the case; a renewed incentive cycle or insurance correction would weaken it.
Before an offer: Build separate Miami-Dade, Broward or Palm Beach comps and identify competitive project deliveries. Quote wind/flood and business-income coverage for the exact building. Never use the regional 5.3% as a published Wynwood or Fort Lauderdale neighborhood cap.
Evidence: Colliers — South Florida Q2 2026 · MMG — Miami Q2 2026 · Florida DFS — Commercial property insurance
Tampa: asset pricing has held better than operating rent
Observed evidence. Matthews reports Q2 rent down 3.16% annually to $1,791 and vacancy at 5.65%, up 84 bps annually despite an improvement from Q1. Its cap series stands near 5.61%. Units under construction total 10,083, below the earlier peak.
Lower future deliveries do not remove properties already leasing. A buyer paying a resilient price against a lower rent roll must either identify a sustainable collection recovery or accept a thinner initial margin. Asking rents and occupancy should be tested against the same competitive properties.
RentalCalcs interpretation. Use stabilization with an expansion stress until income catches up to pricing. The underwriting burden sits on effective renewals, not on a claim that a smaller pipeline guarantees immediate rent acceleration.
What would change the view. Quarterly vacancy improvement is a constructive signal. Continued absorption with fewer incentives would weaken the expansion case; declining renewals or rising buyer costs would strengthen it.
Before an offer: Obtain concessions at competing lease-ups, actual renewal retention and post-sale taxes. Stress the price with current collections before introducing renovation premiums.
Evidence: Matthews — Tampa Q2 2026 · Florida Senate — Statute 193.1555 (2026)
Jacksonville: early rent recovery, thin quarterly sales
Observed evidence. Matthews’ cap series eased 5 bps annually to 5.57%; reported annual rent growth turned positive at 0.64%. Its Q2 sales volume fell 69.5% annually while trailing-year volume rose 25.6%. MMG separately reports effective rents down 0.5% annually and 90.7% occupancy.
A better operating trajectory can coexist with weak transaction liquidity. Matthews’ rent series and MMG’s effective-rent measure should not be spliced into one history. A small quarterly sale cohort can overrepresent a particular class or buyer.
RentalCalcs interpretation. Selective compression is possible as concessions recede, but five basis points does not establish a broad local repricing. The stronger current conclusion is to test the transition from lease-up to durable collected income.
What would change the view. Renewed completion competition or weak employment would undermine the recovery case. Consistent effective-rent increases and a broader set of matched closed sales would make it stronger.
Before an offer: Underwrite effective rather than advertised renewals and allow for exit marketing time. Require local cap-reporting sales matched to the building’s vintage and submarket.
Evidence: Matthews — Jacksonville Q2 2026 · MMG — Jacksonville Q2 2026
Orlando: keep the older cap range separate from newer operations
Observed evidence. Northmarq’s Q4 2025 report describes transaction caps around 5.0–5.5% and anticipated easing financing as a possible compression catalyst. MMG’s newer Q2 2026 summary reports 92.5% occupancy, $1,691 monthly effective rent and a 2.7% annual rent decline.
The prior outlook rested partly on a financing assumption, not just a construction forecast. Newer operating softness can make that old cap range insufficient for a buyer who must fund repairs and new debt today. Tourist-area lease-up and conventional workforce property also need different rent comps.
RentalCalcs interpretation. Treat the older cap as historical context and hold compression out of the acquisition case until a current sale sample and binding financing support it. An annual effective-rent decline is more relevant to buyer cash than the direction of asking-rent advertisements.
What would change the view. MMG describes demand nearly matching trailing-year completions. Sustained renewal improvement could support recovery, but it does not retroactively turn the Q4 cap range into a Q2 measurement.
Before an offer: Map direct competition in Kissimmee/Osceola and other relevant submarkets, reconcile incentives to collections and obtain current NOI-based closed sales. Do not capitalize a forecast rent rebound twice.
Evidence: Northmarq — Orlando Q4 2025 · MMG — Orlando Q2 2026
Fort Myers and Naples: a source boundary break limits the numeric comparison
Observed evidence. Lee’s Q2 2026 PDFs describe softened rents and lease-up competition. Their inventory tables jump from 37,223 to 121,594 units in Fort Myers and 15,318 to 70,175 in Naples between the displayed Q2 2025 and Q2 2026 columns. No reconciling geography/method explanation was verified.
A changed inventory boundary can move vacancy, rents and cap benchmarks without repricing the same properties. The source’s directional discussion is useful, but the displayed annual columns cannot safely be treated as a continuous same-market series.
RentalCalcs interpretation. The responsible stance is a property-level supply and expense test, with quantitative caps withheld pending scope clarification. A recovery narrative requires actual competing deliveries and concession evidence.
What would change the view. A publisher explanation or a stable-geography transaction file could restore comparability. Until then, apparently precise annual cap moves are weaker evidence than they look.
Before an offer: Request corrected geographic definitions, current local sales and site-level lease-up evidence. Separately inspect flood history, roof/opening protection, deductibles and a funded capital plan.
Evidence: Lee & Associates — Fort Myers Q2 2026 · Lee & Associates — Naples Q2 2026 · Florida DFS — Commercial property insurance
Secondary markets, submarkets and the boundary of the data
Neighborhood cap rates need neighborhood sales with a documented NOI basis. Metro operating conditions can guide a property investigation; they cannot manufacture a local cap. These gaps matter when selecting comparable sales and budgeting liquidity.
| Market | Available evidence | What is missing | Next underwriting action |
|---|---|---|---|
| South Florida counties | Regional cap plus Miami operating observations. | No separate neighborhood cap series for Broward or Palm Beach. | Match county, flood zone, age, income basis and insurance terms. |
| Orlando / Kissimmee / Osceola | Older Q4 2025 cap range; newer Q2 2026 operating summary. | No matching current cap series verified. | Get current closed-sale NOI; do not date-shift the old range. |
| Fort Myers / Naples | Q2 Lee commentary and tables inspected. | Unexplained inventory discontinuity; caps withheld. | Clarify provider geography before calculating annual changes. |
| Tallahassee / Gainesville / Pensacola / smaller markets | No matching current NOI cap cohort included. | Student, military, government and seasonal demand require local evidence. | Separate student/per-bed or seasonal leases from annual apartment collections and obtain local comps. |
County tools answer a different screening question. County housing context and rent-to-value models are not matched-property NOI caps: Miami-Dade screening · Hillsborough screening · Duval screening · Orange County screening.
Compression, stabilization or expansion?
Observed evidence: stable South Florida yields, Tampa’s weaker annual rents and Jacksonville’s early recovery describe different positions in the supply cycle. Orlando’s cap reference is older. These sources cannot support a single current statewide direction.
Publisher perspectives: Colliers emphasizes stable South Florida fundamentals and renewed transaction activity. Northmarq’s older Orlando outlook connected possible compression to better financing. Matthews highlights Tampa’s pricing/operating gap and Jacksonville’s improvement. Related commercial reports may share CoStar/RCA inputs; different logos do not prove independent datasets.
Counterevidence: MMG’s effective-rent summaries show annual declines in Miami, Jacksonville and Orlando even where sequential performance improved. These are separate provider series, not contradictory rows to average. Their public summary methodology does not fully disclose inventory eligibility.
RentalCalcs interpretation: use selective stabilization as the reference, with property-specific downside from continuing competition and buyer costs. Compression requires durable effective-income growth plus supportive capital markets. A smaller future pipeline helps the medium term without erasing existing lease-up.
Compression
Deliveries ease, competing concessions end, collected renewals improve and buyers obtain executable debt at better terms.
Watch: Concession-adjusted rent, matched closed-sale NOI, actual insurance renewals and lender quotes.
Invalidated or weakened by: Occupancy gains bought with free rent, income consumed by expenses, or apparent cap tightening driven by a higher-quality sale mix.
Underwrite: Keep compression as upside until the property works on current buyer NOI at a flat exit.
Stabilization — working case
Absorption gradually balances existing supply while buyer yield requirements offset modest income recovery.
Watch: Local deliveries versus absorption, renewals, premium quotes and assessment estimates.
Invalidated or weakened by: Repeated effective-rent declines or a broad change in matched sale and financing yields.
Underwrite: Use a flat exit, conservative effective rent and explicit liquidity for deductibles and capital work.
Expansion
New lease-ups prolong concessions while taxes, insurance or financing require a larger return on the remaining NOI.
Watch: Competing project openings, policy exclusions/deductibles, collection loss and lender sizing.
Invalidated or weakened by: Persistent NOI improvement after all buyer costs and a broader stable-cap transaction sample.
Underwrite: Stress reduced NOI with a wider exit cap; reduce price before relying on future refinancing relief.
These are conditional editorial cases, not probabilities or publisher basis-point forecasts. A lower short-term policy rate does not guarantee a cheaper property loan: the Treasury curve, lender spread, amortization and proceeds all matter. Cap spreads alone do not measure total risk.
Separate the income decision from the cap-rate decision
Value = annual NOI ÷ (cap rate ÷ 100). At $165,000 NOI and a 5.50% cap, value is $3,000,000. Widening the cap by 100 basis points to 6.50%, with NOI unchanged, changes gross value by -15.4%. A one-point cap move is not a one-percent price move.
- Find the actual supply competitionList directly competing deliveries and concessions; distinguish the thinning pipeline from projects still leasing.
- Quote the buyer cost resetObtain post-acquisition taxes and binding property, wind/flood and interruption terms with deductible cash.
- Reconcile the effective rentDeduct incentives and collection loss once; match annual apartment leases rather than seasonal or student assumptions.
- Stress both valuation inputsTest lower buyer NOI and a wider exit cap together, then size debt and reserve liquidity.
Original underwriting sequence for Florida. Choose an exit yield independently of the income growth needed to justify the deal.
| Cumulative NOI change | 4.50% exit cap | 5.50% exit cap | 6.50% exit cap | 7.50% exit cap |
|---|---|---|---|---|
| -10% total | +10.0% | -10.0% | -23.8% | -34.0% |
| 0% total | +22.2% | 0.0% | -15.4% | -26.7% |
| +10% total | +34.4% | +10.0% | -6.9% | -19.3% |
| +20% total | +46.7% | +20.0% | +1.5% | -12.0% |
Original calculations. This reference table does not change with the tool. NOI growth is cumulative, not annual. Simple property values exclude debt payoff, sale costs, income/capital-gains taxes and interim cash flows; they are not total investment returns.
One acquisition, one reconciled buyer budget
This hypothetical 24-unit purchase illustrates the report’s decision process; it is not a listing, appraisal or local cost quote. Replace each assumption with property evidence. Every line below belongs to the same acquisition.
| Budget line | Annual amount | Basis |
|---|---|---|
| Scheduled income | $432,000 | 24 units × $1,500 monthly × 12 |
| Vacancy, concessions and collection loss | −$43,200 | 10.0% of scheduled; one combined deduction |
| Effective collected income | $388,800 | Scheduled less combined loss |
| Buyer property taxes | $72,000 | Illustrative buyer expense; verify actual evidence |
| Insurance | $48,000 | Illustrative buyer expense; verify actual evidence |
| Management | $19,440 | Illustrative buyer expense; verify actual evidence |
| Recurring repairs | $30,000 | Illustrative buyer expense; verify actual evidence |
| Owner utilities | $24,000 | Illustrative buyer expense; verify actual evidence |
| Administration and recurring compliance | $30,360 | Illustrative buyer expense; verify actual evidence |
| Recurring expense total | $223,800 | Sum of six operating rows |
| NOI / going-in cap | $165,000 / 5.50% | Before debt, replacement reserve and income tax |
Post-acquisition property taxes can differ from the seller’s bill
Florida Statute 193.1555 provides assessment rules for covered property, including a just-value reassessment after a qualifying ownership/control change, with exceptions. Its 10% assessment limitation excludes school levies; it is not a 10% cap on every buyer tax bill. Confirm the subject’s classification, just value, exemptions, non-ad valorem charges and full district rates with the county property appraiser. Florida Senate — Statute 193.1555 (2026).
A lower premium is not necessarily less retained risk
Florida DFS commercial guidance distinguishes policy forms, coinsurance and interruption coverage. Obtain binding wind, flood and property terms with replacement values and exclusions. Commercial-residential hurricane deductible options can differ by policy. Hold deductible liquidity separately from the annual premium and from known roof or structural work. Florida DFS — Commercial property insurance.
Building type controls the compliance review
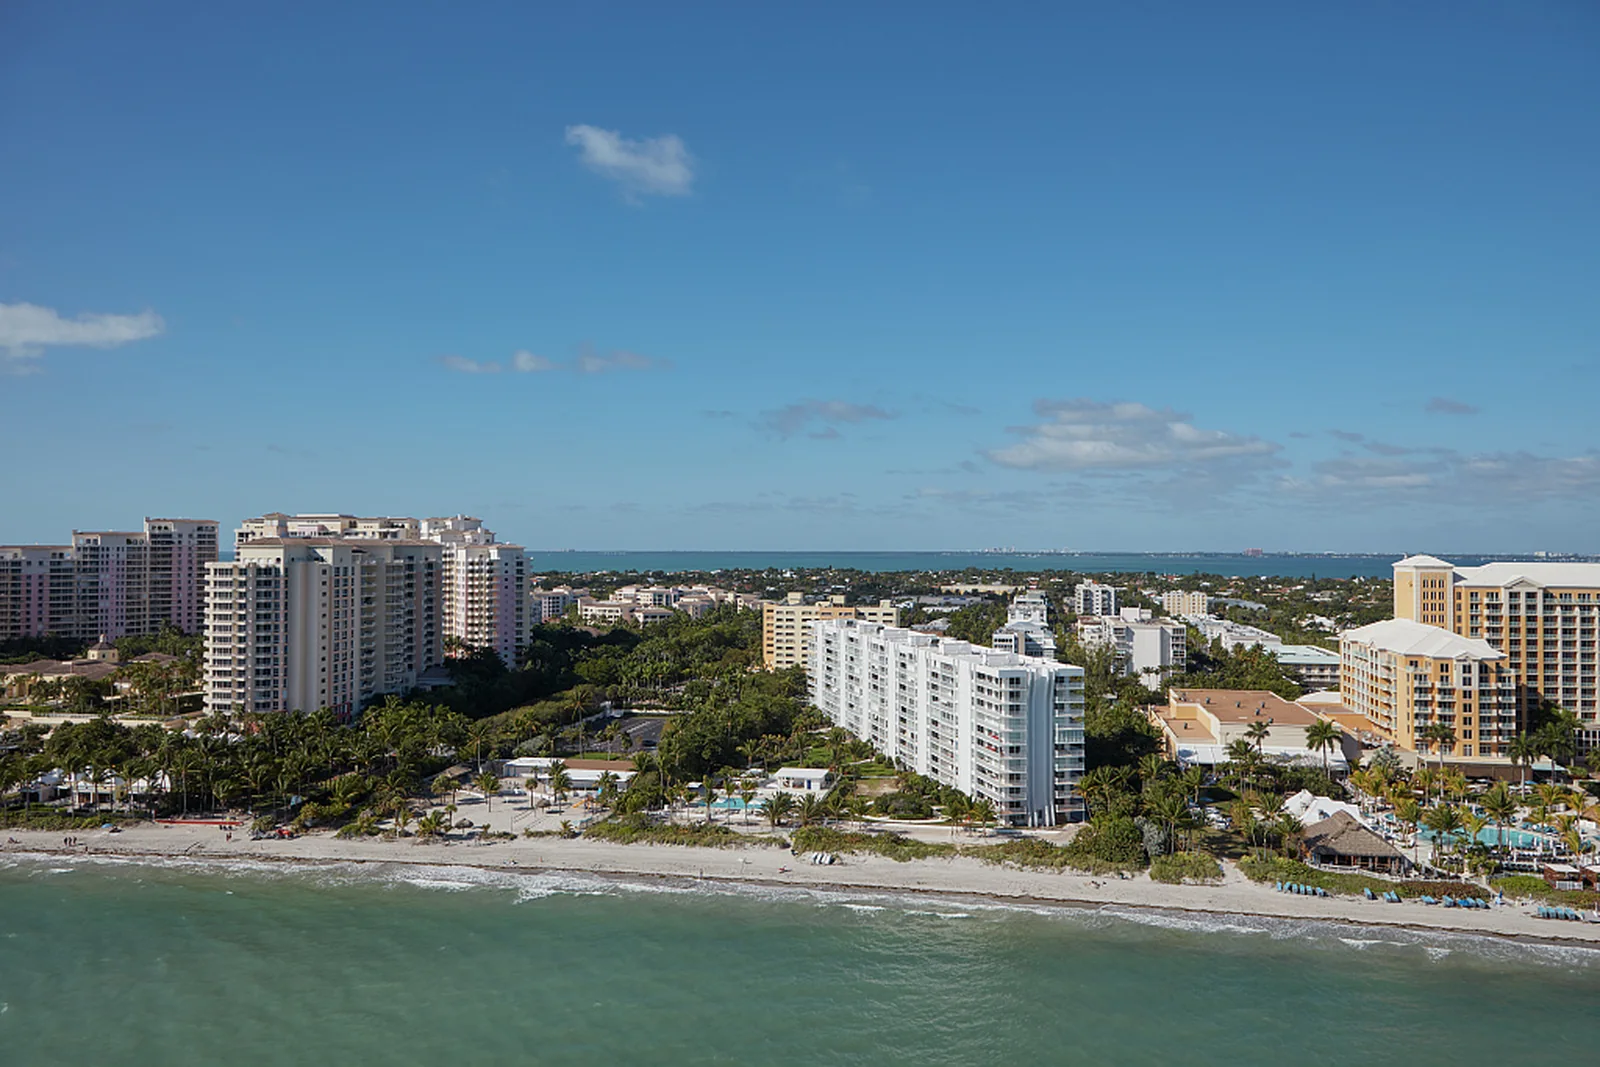
The apartment example is not a condominium association budget. Obtain the property’s actual inspection and code files and separately establish any applicable structural, local licensing and life-safety requirements. A coastal photograph cannot establish flood elevation, insurability or a building’s condition. Florida DFS — Hurricane deductible.
| Measure | Amount / treatment |
|---|---|
| Loan / interest / amortization | $1,650,000 / 6.5% / 30 years |
| Annual debt service | $125,149 |
| Replacement reserve below NOI | $14,400 per year |
| Invested cash | $1,590,000 = $1,350,000 down + $90,000 closing + $150,000 immediate capital work |
| Cash after debt and reserve | $25,451; cash-on-cash 1.60%, before income tax |
| DSCR / debt yield before reserves | 1.32× / 10.00% |
| DSCR after replacement reserve | 1.20×; confirm lender convention |
The mortgage constant is 7.58%. Lender sizing may be limited by coverage, leverage, debt yield or reserve-adjusted NOI. A hypothetical 1.25× coverage requirement before reserves would allow $132,000 annual debt service; this is a sizing illustration, not a universal lender rule. Yield on total acquisition cost, using current NOI and price plus closing and immediate work, is 5.09%. It differs from the going-in cap; future stabilized yield on cost would need a separate earned NOI and all carrying/rehabilitation costs.
Core report analysis is free. Enter your assumptions again in the linked calculator; they do not transfer automatically. A tool click is separate from a completed calculation or saved analysis.
Before relying on Florida cap-rate evidence
What is the average cap rate in Florida?
This evidence does not establish a defensible statewide average. South Florida, Tampa, Jacksonville and Orlando have different publisher methods and dates. Use the exact table and obtain matching property comps rather than averaging the rows.
Does a declining construction pipeline guarantee compression?
No. Units already delivered may still need to lease, and occupied apartments may carry concessions. Compression also depends on buyer costs, financing and the return investors require.
Why omit Southwest Florida cap numbers?
The inspected tables show large unexplained inventory changes. Publishing a precise annual comparison without resolving that boundary would create false confidence. Property-level sale evidence and clarified source geography are the next steps.
Keep the evidence with the offer
Record the comp basis, buyer budget, debt sizing, capital work and the fact that would change your thesis.
Open the free printable Florida worksheetCheck what belongs in NOI · Compare California’s separately researched report · Florida county directory
Sources, lineage and refresh policy
Accessed and substantively reviewed October 18, 2026. Each observation retains its actual period. Public summaries often omit cap-reporting sample size, NOI convention and weighting; no missing field is inferred. Brokerages have commercial advisory interests. Publications sharing CoStar, RCA/MSCI or one proprietary database do not establish independent corroboration.
Read the full source ledger, methods and refresh triggers
- Colliers — South Florida Q2 2026
Observation / applicability: Q2 2026. Publication: July 23, 2026. Access and review: October 18, 2026.
Underlying provider: Colliers; underlying cap provider not fully disclosed in public summary Geography / asset: South Florida regional multifamily composite
Statistic, NOI, sample, weighting and limits: Published regional cap benchmark 5.3%; cap-reporting count, weighting and NOI basis undisclosed. Not a county-level series.
Refresh trigger: Q3 edition or provider clarification.
- Matthews — Tampa Q2 2026
Observation / applicability: Q2 2026; annual comparisons where explicitly reported. Publication: August 12, 2026. Access and review: October 18, 2026.
Underlying provider: Matthews research; underlying cap methodology/provider not disclosed in inspected summary Geography / asset: Publisher-defined Tampa multifamily market
Statistic, NOI, sample, weighting and limits: Publisher cap series, not asserted as a verified closed-sale average. NOI convention, cap count and weighting undisclosed. Quarter sales volume separate from trailing-year volume; rent measure not silently harmonized with MMG.
Refresh trigger: Next quarterly report or methodology correction.
- Matthews — Jacksonville Q2 2026
Observation / applicability: Q2 2026; annual comparisons where explicitly reported. Publication: August 20, 2026. Access and review: October 18, 2026.
Underlying provider: Matthews research; underlying cap methodology/provider not disclosed in inspected summary Geography / asset: Publisher-defined Jacksonville multifamily market
Statistic, NOI, sample, weighting and limits: Publisher cap series, not asserted as a verified closed-sale average. NOI convention, cap count and weighting undisclosed. Quarter sales volume separate from trailing-year volume; rent measure not silently harmonized with MMG.
Refresh trigger: Next quarterly report or methodology correction.
- Northmarq — Orlando Q4 2025
Observation / applicability: Q4 2025 observations; 2026 forecasts separately attributed. Publication: January 30, 2026. Access and review: October 18, 2026.
Underlying provider: Northmarq; REIS operations; sales/development industry providers not independently corroborated Geography / asset: Orlando multifamily; class/submarket range
Statistic, NOI, sample, weighting and limits: Approximate average transaction range 5.0–5.5%; sample, weighting and NOI undisclosed. Historical context, not current 2026 cap evidence.
Refresh trigger: Newer matching cap report or changed financing assumptions.
- MMG — Miami Q2 2026
Observation / applicability: Q2 2026; trailing four-quarter absorption/completions. Publication: Exact day not stated. Access and review: October 18, 2026.
Underlying provider: MMG; underlying provider not disclosed in inspected public summary Geography / asset: Publisher Miami operating inventory
Statistic, NOI, sample, weighting and limits: Effective-rent and occupancy series; inventory scope/weighting not fully disclosed. No new cap statistic and no splicing with other publishers.
Refresh trigger: Next quarter or full methodology clarification.
- MMG — Jacksonville Q2 2026
Observation / applicability: Q2 2026; trailing four-quarter absorption/completions. Publication: Exact day not stated. Access and review: October 18, 2026.
Underlying provider: MMG; underlying provider not disclosed in inspected public summary Geography / asset: Publisher Jacksonville operating inventory
Statistic, NOI, sample, weighting and limits: Effective-rent and occupancy series; inventory scope/weighting not fully disclosed. No new cap statistic and no splicing with other publishers.
Refresh trigger: Next quarter or full methodology clarification.
- MMG — Orlando Q2 2026
Observation / applicability: Q2 2026; trailing four-quarter absorption/completions. Publication: Exact day not stated. Access and review: October 18, 2026.
Underlying provider: MMG; underlying provider not disclosed in inspected public summary Geography / asset: Publisher Orlando operating inventory
Statistic, NOI, sample, weighting and limits: Effective-rent and occupancy series; inventory scope/weighting not fully disclosed. No new cap statistic and no splicing with other publishers.
Refresh trigger: Next quarter or full methodology clarification.
- Lee & Associates — Fort Myers Q2 2026
Observation / applicability: Q2 2026 with prior-year table. Publication: July 2026 file path; exact day unstated. Access and review: October 18, 2026.
Underlying provider: Lee; CoStar and proprietary inputs among listed providers Geography / asset: Publisher Fort Myers multifamily geography not reconciled across years
Statistic, NOI, sample, weighting and limits: Inventory discontinuity prevents safe same-geography annual comparison. Caps withheld pending clarification. Directional commentary attributed only.
Refresh trigger: Corrected inventory/geography documentation.
- Lee & Associates — Naples Q2 2026
Observation / applicability: Q2 2026 with prior-year table. Publication: July 2026 file path; exact day unstated. Access and review: October 18, 2026.
Underlying provider: Lee; CoStar and proprietary inputs among listed providers Geography / asset: Publisher Naples multifamily geography not reconciled across years
Statistic, NOI, sample, weighting and limits: Inventory discontinuity prevents safe same-geography annual comparison. Caps withheld pending clarification. Directional commentary attributed only.
Refresh trigger: Corrected inventory/geography documentation.
- Florida Senate — Statute 193.1555 (2026)
Observation / applicability: 2026 statute. Publication: 2026 codification. Access and review: October 18, 2026.
Underlying provider: Florida Legislature Geography / asset: Covered residential/nonresidential real property; statutory exceptions apply
Statistic, NOI, sample, weighting and limits: Assessment limits, school-levy boundary and ownership-change rules; no buyer assessment or tax quote.
Refresh trigger: Law changes and subject property appraiser determination.
- Florida DFS — Commercial property insurance
Observation / applicability: Guidance accessed October 18, 2026. Publication: Day not stated. Access and review: October 18, 2026.
Underlying provider: Florida DFS Geography / asset: Commercial property coverage
Statistic, NOI, sample, weighting and limits: Coverage/coinsurance/interruption reference, no premium forecast.
Refresh trigger: Binding quote and policy renewal.
- Florida DFS — Hurricane deductible
Observation / applicability: Current guidance at review. Publication: Day not stated. Access and review: October 18, 2026.
Underlying provider: Florida DFS Geography / asset: Policy-specific hurricane deductibles; commercial-residential options discussed
Statistic, NOI, sample, weighting and limits: Deductible cash is not an annual operating premium. No universal deductible assumed.
Refresh trigger: Policy terms and statutory changes.
- CBRE — U.S. Cap Rate Survey H1 2026
Observation / applicability: Late June 2026 survey; six-month expectations. Publication: August 12, 2026. Access and review: October 18, 2026.
Underlying provider: More than 200 CBRE professionals; 3,600 estimates Geography / asset: National commercial-property sentiment
Statistic, NOI, sample, weighting and limits: Professional estimates and expectations; not a NY transaction series. No state probabilities inferred.
Refresh trigger: H2 survey or material financing change.
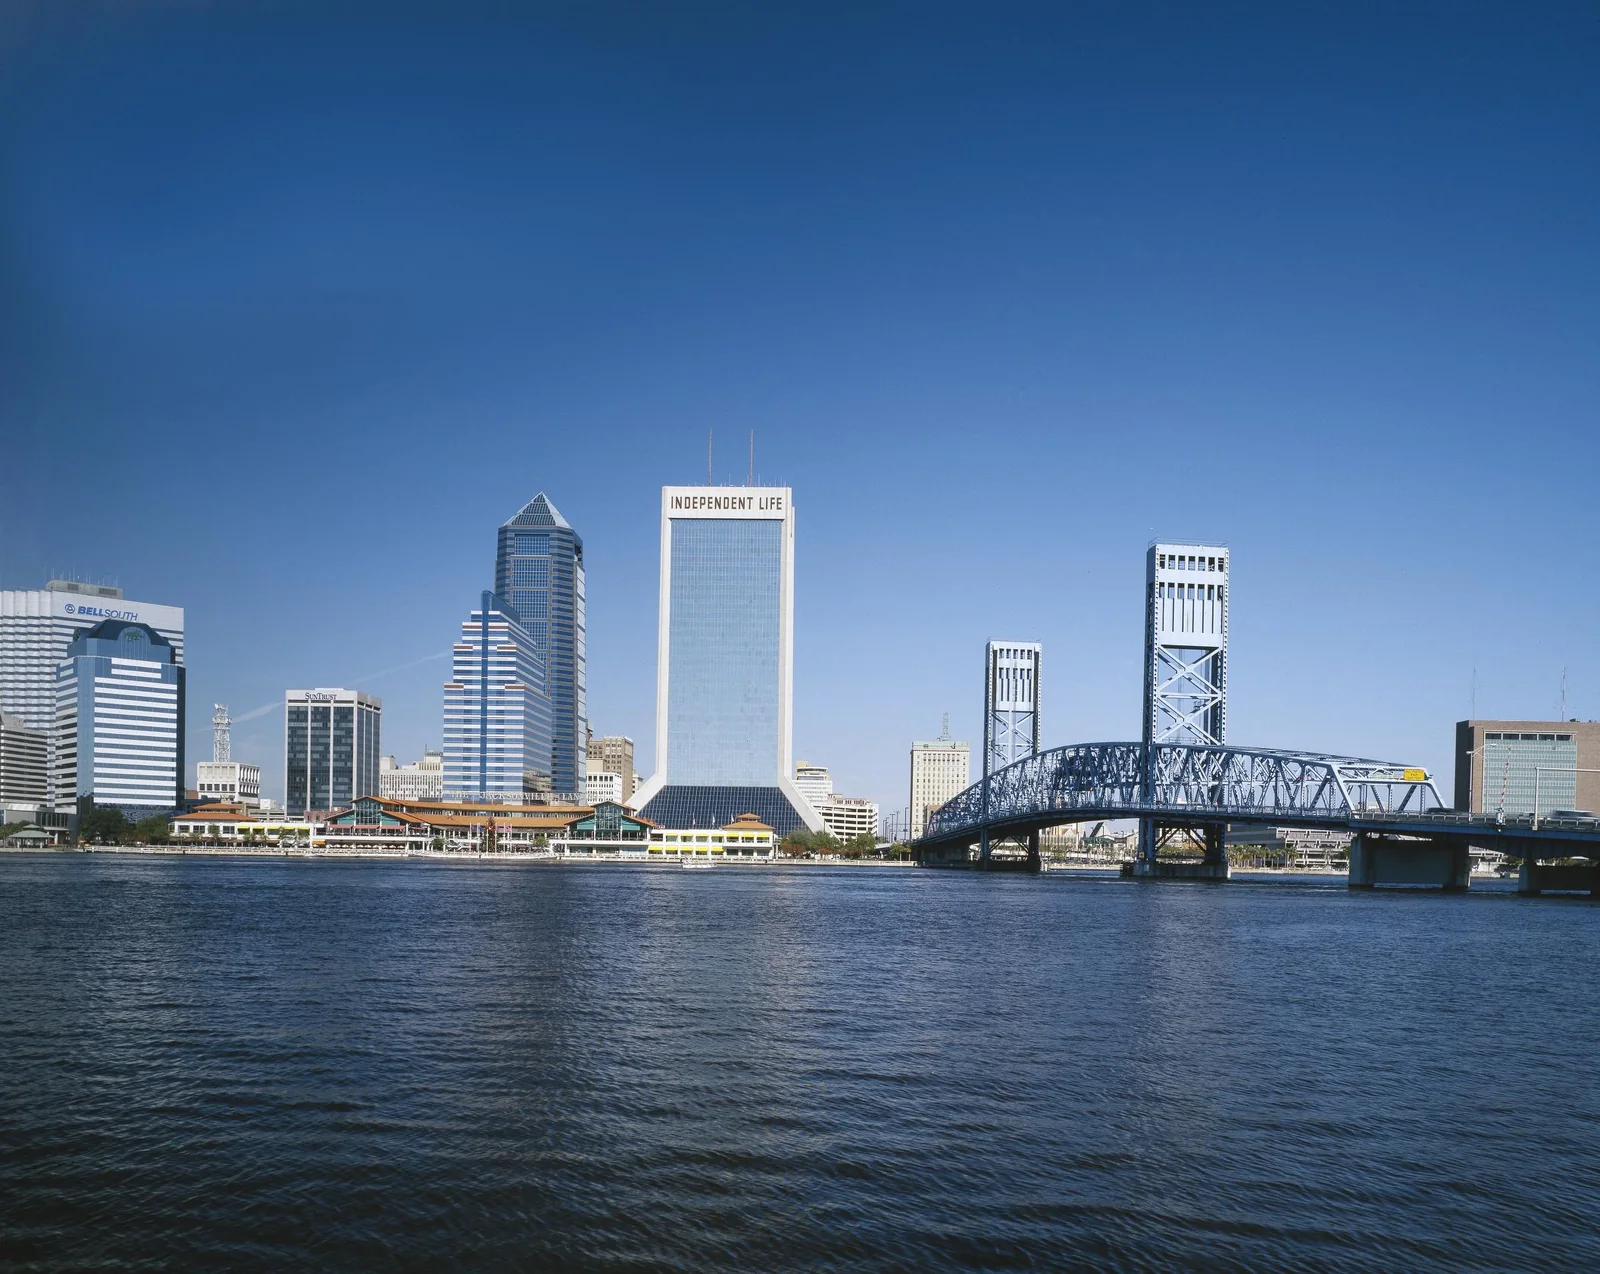
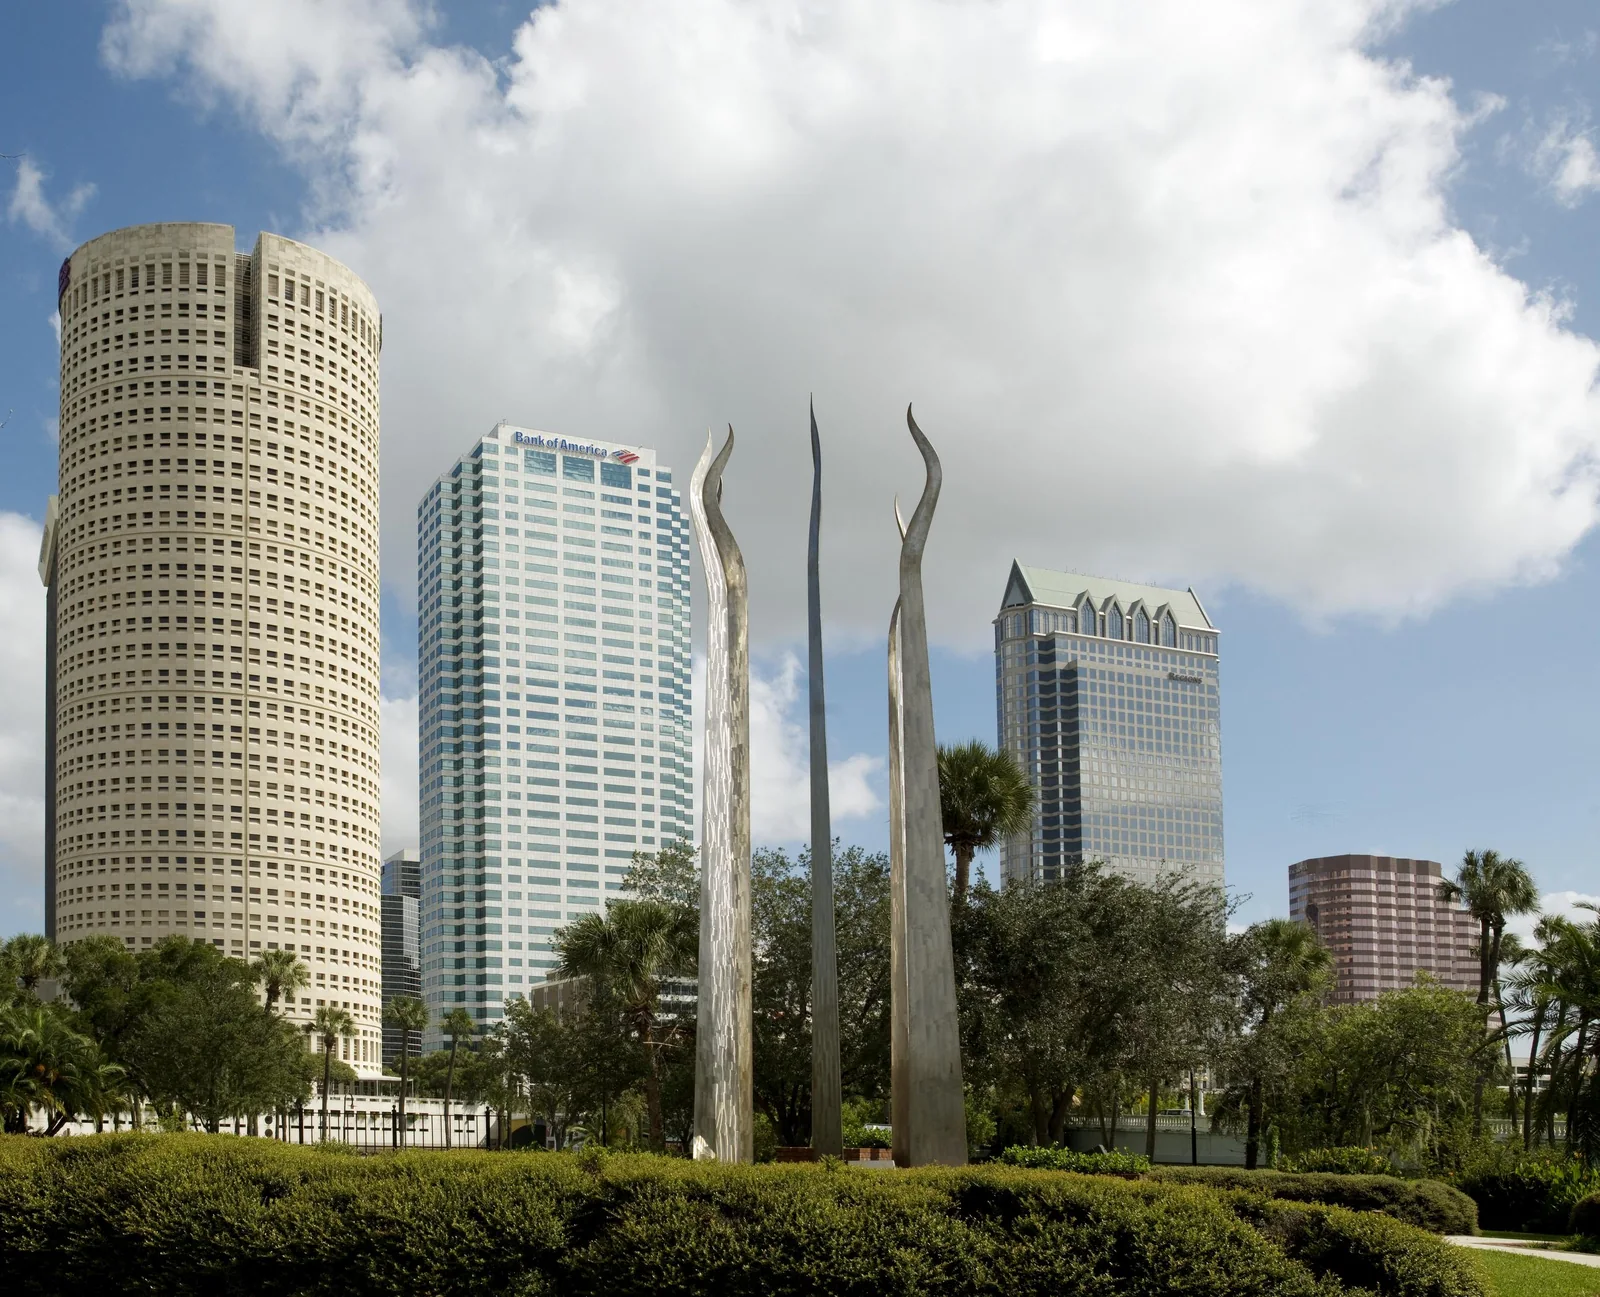
Research editions are checked against publisher directories; coverage gaps and unresolved contradictions remain beside the affected evidence. Photographs provide archival building/location context, not current property condition or appraised sale evidence. The original contribution is the comparison, underwriting logic and reproducible scenarios. Review dates advance only after substantive checking.
Send a correction with the source URL, geography and observation date.