Atlanta rent & investment research · GA
Atlanta metro rent report
Buy Atlanta’s occupied income before pricing a suburban lease-up or a Midtown premium.
Zillow all-home metro asking-rent index · All bedroom counts · Seasonally adjusted
By RentalCalcs editorial · Reviewed
Live refresh status unavailable; showing the dated source snapshot shipped with this edition.

The investment view
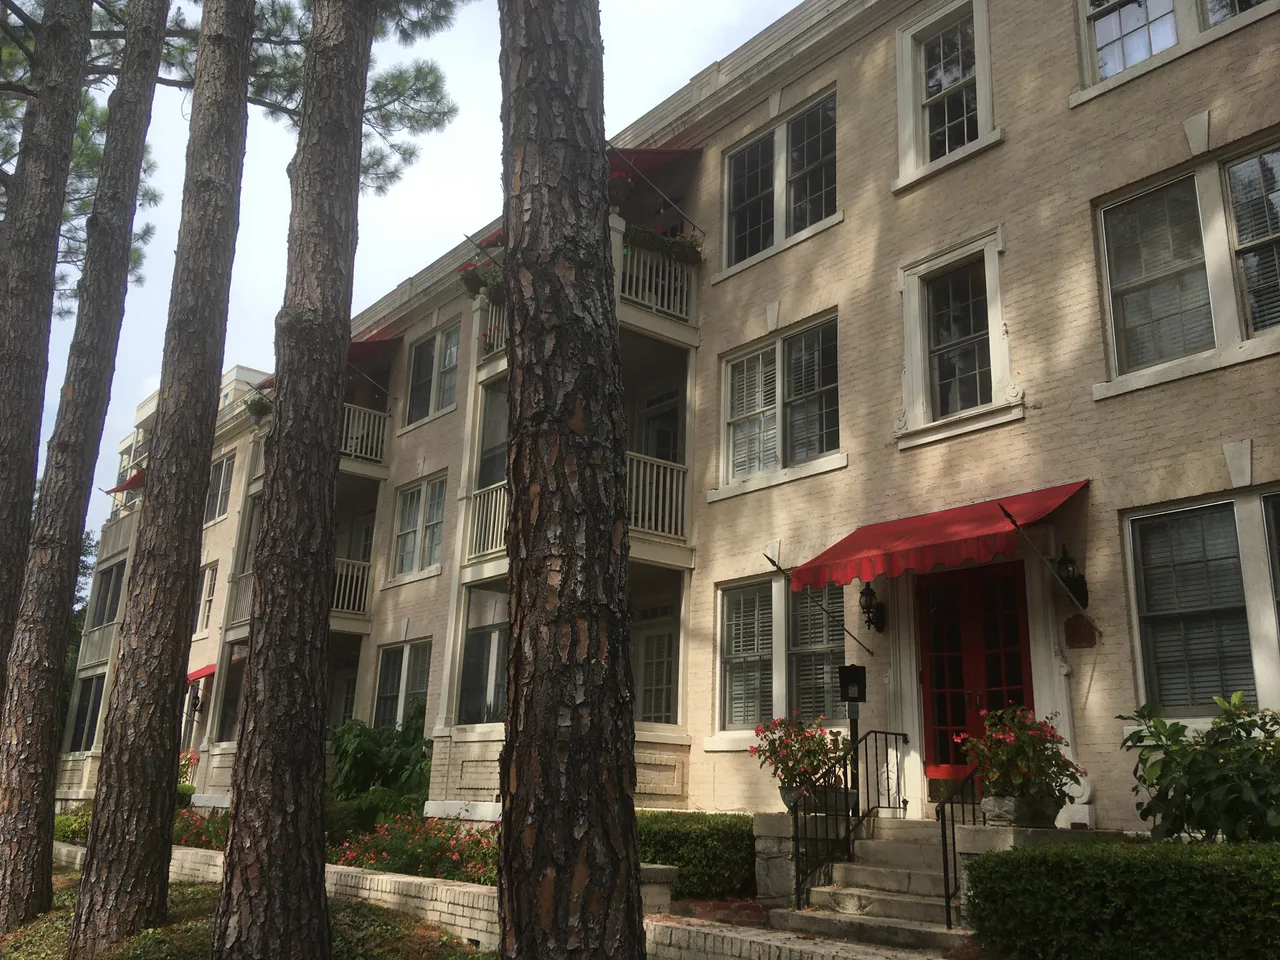
Favor an established small building whose existing collections cover the buyer’s expenses and debt. Apartment demand improved in Q2 2026, but that does not make an advertised rent immediately collectible. For a suburban repositioning, price the actual competing deliveries and a funded first year; for an intown property, verify the building-level rent advantage before paying a tower-based price.
Typical Atlanta metro asking rent is a starting point for a property’s lease budget
The all-home metro index is $1,843 per month, +2.3% from the same month a year earlier and +5.0% over three years. This is Zillow’s Atlanta provider market across Georgia counties, rather than Atlanta city or a bedroom-specific apartment quote.
Monthly rent data
| Month | Typical rent |
|---|---|
| September 2021 | $1,622 |
| October 2021 | $1,648 |
| November 2021 | $1,666 |
| December 2021 | $1,677 |
| January 2022 | $1,685 |
| February 2022 | $1,691 |
| March 2022 | $1,700 |
| April 2022 | $1,710 |
| May 2022 | $1,724 |
| June 2022 | $1,735 |
| July 2022 | $1,745 |
| August 2022 | $1,749 |
| September 2022 | $1,750 |
| October 2022 | $1,749 |
| November 2022 | $1,751 |
| December 2022 | $1,757 |
| January 2023 | $1,759 |
| February 2023 | $1,762 |
| March 2023 | $1,769 |
| April 2023 | $1,773 |
| May 2023 | $1,772 |
| June 2023 | $1,765 |
| July 2023 | $1,761 |
| August 2023 | $1,757 |
| September 2023 | $1,755 |
| October 2023 | $1,753 |
| November 2023 | $1,752 |
| December 2023 | $1,753 |
| January 2024 | $1,757 |
| February 2024 | $1,762 |
| March 2024 | $1,763 |
| April 2024 | $1,764 |
| May 2024 | $1,764 |
| June 2024 | $1,766 |
| July 2024 | $1,765 |
| August 2024 | $1,763 |
| September 2024 | $1,763 |
| October 2024 | $1,765 |
| November 2024 | $1,768 |
| December 2024 | $1,771 |
| January 2025 | $1,776 |
| February 2025 | $1,783 |
| March 2025 | $1,789 |
| April 2025 | $1,791 |
| May 2025 | $1,791 |
| June 2025 | $1,791 |
| July 2025 | $1,793 |
| August 2025 | $1,798 |
| September 2025 | $1,802 |
| October 2025 | $1,806 |
| November 2025 | $1,808 |
| December 2025 | $1,810 |
| January 2026 | $1,809 |
| February 2026 | $1,806 |
| March 2026 | $1,807 |
| April 2026 | $1,810 |
| May 2026 | $1,817 |
| June 2026 | $1,824 |
| July 2026 | $1,832 |
| August 2026 | $1,837 |
| September 2026 | $1,843 |
The consequential acquisition question is whether the rent recovery reaches the leases being purchased. An owner with occupied, paying units can earn income while nearby supply fills. A buyer of vacant or heavily repositioned units must finance the competition before benefiting from the same recovery. Underwrite those two calendars separately.
Absorption exceeded Q2 deliveries, while suburban competition still needs a street-level check
Northmarq apartment coverage · Q2 2026 · rounded units
Northmarq identifies Henry County, South Cobb/Douglasville and the Far East and Far North suburbs as recent delivery and leasing corridors. A positive metro flow does not remove a nearby project’s incentives. Walk the competitive set through actual delivery dates, available floor plans and collected new leases; distinguish an approved project from units residents can occupy.
Integra’s August midyear summary remains more cautious about supply pressure and points to limited new lower-priced product benefiting Class C. Its public summary does not establish a directly comparable vacancy series. The disagreement supports a narrower decision: buy a particular building’s supportable income, and test whether adjacent new supply can pull away its next renter.
The contrary case is a discounted suburban building where leasing has already improved and acquisition cash can fund slower stabilization. The upside needs executed leases, a credible cost schedule and sufficient discount. An expectation that construction will eventually decline does not pay current loan bills.
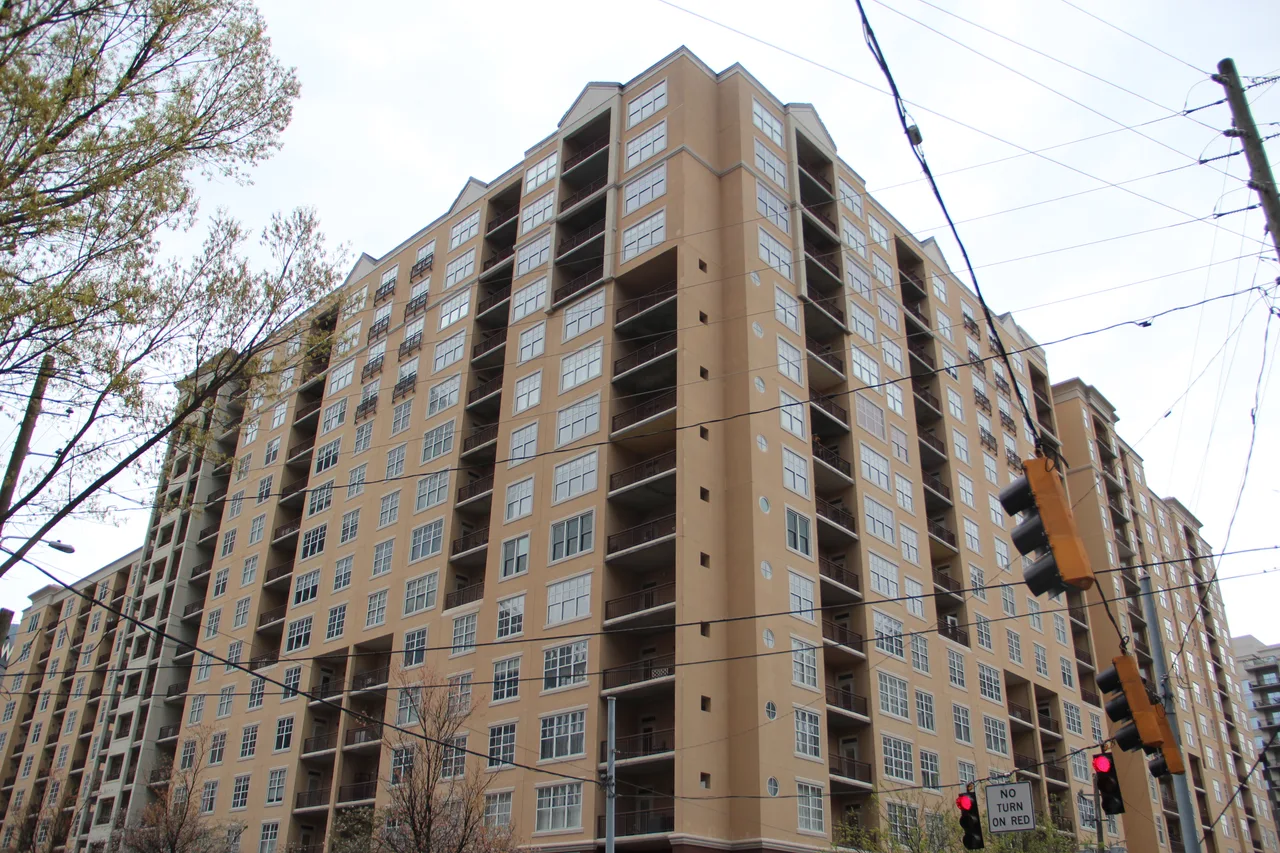
Midtown’s higher apartment rent cannot be transferred to an older low-rise

| Population | Monthly asking rent | Annual change |
|---|---|---|
| Atlanta apartment market | $1,655 | +1.3% |
| North DeKalb | $1,741 | +3.7% |
| Midtown | $2,539 | +3.6% |
The $798 gap between those two submarket averages is not the return to renovating one apartment. It includes differences in location and building mix. A garden property in DeKalb needs garden-property comparisons with similar size, condition, utilities and trip to work. An intown building needs evidence that residents pay for its actual access and services, after parking, fees and incentives.
For each comparison, record the lease term, face rent, one-time discount, mandatory monthly charges and included utilities. Confirm whether a quoted incentive applies to the actual unit and start date. An attractive headline at a large community can compete with a smaller property even when the buildings are physically different.
For a condominium rental, obtain the governing documents, rental restrictions, assessments and owner’s insurance responsibilities before using a residential tower’s rent as income. For a small building, price roof, drainage, shared utilities and legal occupancy directly. Neither building age nor the word “luxury” supplies the expense sheet.
Use Fulton County research, DeKalb County research and the Atlanta postal-city ZIP lookup to orient the comparison; the purchase still needs matched leases and the actual municipal jurisdiction.
Four one-month incentives remove $6,600 from an eight-unit building’s first-year receipts
Assumed $1,650 rents · four new leases · twelve-month terms
The stabilized model below assumes an 8% allowance for vacancy and unpaid rent, with no additional incentive. If four leases then receive the assumed discount, subtract $6,600 from first-year receipts only if that allowance did not already include it. The incentive can exhaust modest annual cash flow even though the stabilized NOI looks adequate.
A single acquisition-year incentive is not a perpetual $6,600 NOI loss. Do not capitalize it into a permanent value reduction unless ongoing renewals require an equivalent recurring concession. Conversely, a seller cannot call repeated annual incentives “one-time” to inflate stabilized income. Reconcile lease-level discount records across several turns.
An assumed $1.15 million eight-unit must work before rent growth arrives
Assume eight units at $1,650, 8% vacancy/collection loss, $72,000 annual operating expenses and $8,000 capital reserves. Initial repairs are $60,000, closing costs 3%, and debt is 65% of price at an assumed 7.25% over 30 years. Operating expenses include buyer-specific taxes, insurance, management, maintenance and owner-paid utilities. No immediate renovation premium is assumed.
Acquisition lab · assumed Atlanta property
Editable assumptions, not an available listing or financing quote. Closing costs are fixed at 3% of purchase price; repairs are paid upfront. No appreciation, tax benefits, refinancing proceeds or rent growth are needed to generate the results.
Edit property assumptions
| Measure | Base | Downside |
|---|---|---|
| Scheduled rent | $158,400 | $150,480 |
| After vacancy / collection loss | $145,728 | $133,927 |
| Net operating income (NOI) | $73,728 | $54,727 |
| Annual loan payments | $61,191 | $61,191 |
| Cash after debt + capital reserve | $4,537 | -$14,464 |
| Debt coverage (NOI ÷ payments) | 1.20× | 0.89× |
NOI excludes financing and capital reserves. Operating expenses must include taxes, insurance, management, routine maintenance and owner-paid utilities. A reserve reduces spendable cash; it does not make a known roof or sewer replacement disappear. Results describe a stabilized year after initial repairs. Fund renovation downtime and carrying costs separately; they are not estimated here.
| Required yield | Base NOI | Downside NOI |
|---|---|---|
| 6.5% | $1,042,987 | $759,181 |
| 7.5% | $896,155 | $650,190 |
| 8.5% | $783,872 | $566,844 |
A price below a yield ceiling can still fail debt coverage or require more cash than you have. Check the loan terms, unit-level leases and a contractor’s scope before treating a modeled ceiling as an offer.
Base NOI is $73,728 on $1,244,500 total basis, with $497,000 acquisition cash invested. The combined downside cuts rent 5%, raises loss by three percentage points and increases operating expenses 10%. It tests whether the investment can wait for a recovery; it is not a forecast of Atlanta performance.
The price-sensitivity table uses assumed required yields on total cost. These are personal underwriting hurdles, not measured Atlanta cap rates. Add initial lease-up liquidity, work downtime and financing fees outside the fixed 3% closing allowance when they apply. A roof reserve cannot also fund a concession without leaving replacement work unfunded.
Buy a defensible rent position; renovate only after its net premium is demonstrated
Acquire or hold collected income at a sufficient basis
Favor an occupied property whose rents remain competitive after full lease charges and whose expenses survive the stress case. Lower-priced existing housing can meet a different budget than new apartments, but verify the retention and collection record rather than assuming Class C is recession-proof.
Make suburban lease-up cash part of the offer
For Henry County, Douglasville or a farther growth corridor, list competing completions and reconcile incentives with the monthly cash calendar. A discounted vacant building may be attractive when the remaining cash and local leasing evidence support a slower fill. Reduce the offer or pass when the deal requires both rapid occupancy and disappearing concessions.
Renovate at a funded turn
Require a matched net premium after extra management, insurance and replacement costs. Preserve productive leases while pricing essential systems. Reconsider the thesis when effective executed rents improve across the actual comparison set, repeat incentives decline and your building retains tenants through the next competing delivery.
The Georgia rent guide provides statewide discovery; the multifamily calculator extends the property budget. The distinct Atlanta metro overview covers wider investment screening.
Questions that change an Atlanta rent assumption
Is the metro index a two-bedroom rent quote?
No. The index combines home types and bedroom counts. Compare the actual unit with similar signed leases, then account for mandatory charges, utilities and incentives.
Does improving apartment absorption justify increasing an offer?
Only if the building’s achievable net collections or risk have improved enough to support it. A metro recovery can coexist with a nearby project still offering discounts and a property needing substantial work.
How should a renter compare a free month with a lower advertised rent?
Compare the full committed term, fees and utilities; then check cash due in each month. A discount improves total cost but does not lower every future payment or guarantee the next renewal price.
Sources and methodology
Evidence behind this report
- Northmarq Atlanta Q2 2026 report, published October 9, 2026. Roughly 6,000 quarterly absorption versus 2,700 completions; 16,243 under construction. Page 3: 5.8% vacancy, $1,655 asking rent; North DeKalb $1,741/+3.7% annually, Midtown $2,539/+3.6%. Apartment populations use RealPage for vacancy and REIS for rent; not the all-home ZORI geography or matched small-property comparisons.
- Original Northmarq PDF, Q2 2026, pages 1–5; visually checked page 3. The page 1 bullet says “third quarter” despite Q2 headings; use the explicit page 3 Q2 discussion. Forecasts are not observations. Vendor boundaries, sampling and weights are not fully disclosed.
- Integra Realty Resources, August 2026 midyear Atlanta public summary: supply pressure, Class C’s limited competing lower-priced supply and uneven performance. Different coverage/timing from Northmarq; no harmonized vacancy estimate or implied independent unit-level census. Full member-only research was not accessed.
- Zillow all-home, all-bedroom, smoothed, seasonally adjusted metro ZORI CSV; observation 2026-09-30; retrieved 2026-10-21T03:09:00.655Z UTC
- Zillow repeat-rent methodology
- Census July 2023 metro delineations
- Zillow county-to-metro crosswalk, retrieved 2026-10-21T03:09:00.971Z
Geography and comparable populations
The July 2023 official metro includes Lumpkin County and excludes Lamar County. Zillow’s undated crosswalk instead includes Lamar and omits Lumpkin. The headline retains Zillow’s provider market, not a reconstructed 29-county CBSA estimate. The separate GA–AL combined statistical area is not this Georgia-only metro. Official CBSA: 12060; separate Zillow RegionID: 394347. County and city figures are useful local checks but cannot reproduce this metro index.
| County | State | Zillow crosswalk |
|---|---|---|
| Barrow County | GA | Included |
| Butts County | GA | Included |
| Carroll County | GA | Included |
| Clayton County | GA | Included |
| Coweta County | GA | Included |
| Dawson County | GA | Included |
| DeKalb County | GA | Included |
| Douglas County | GA | Included |
| Fayette County | GA | Included |
| Forsyth County | GA | Included |
| Fulton County | GA | Included |
| Gwinnett County | GA | Included |
| Heard County | GA | Included |
| Henry County | GA | Included |
| Jasper County | GA | Included |
| Lumpkin County | GA | Not included |
| Meriwether County | GA | Included |
| Morgan County | GA | Included |
| Newton County | GA | Included |
| Pickens County | GA | Included |
| Pike County | GA | Included |
| Rockdale County | GA | Included |
| Spalding County | GA | Included |
| Walton County | GA | Included |
| Bartow County | GA | Included |
| Cherokee County | GA | Included |
| Cobb County | GA | Included |
| Haralson County | GA | Included |
| Paulding County | GA | Included |
What the rent index measures
ZORI follows repeat asking-rent changes, weights toward the rental stock and smooths observations. It does not measure every signed lease, concessions, a two-bedroom quote, property income or a voucher payment standard. Broker apartment surveys have their own boundaries and property populations. Their vacancy and effective-rent readings are labeled by period and are never averaged into ZORI.
The headline and historical chart use one validated version. The file contains 740 metro rows; 740 have a latest-month observation. These are market counts, not rental-unit sample sizes; Zillow does not supply underlying unit sample counts here. Missing observations remain missing and prior months may be revised.
Refresh and editorial review
Provider Last-Modified: Fri, 16 Oct 2026 01:56:12 GMT. This page serves the committed last-good snapshot. The shared weekly refresh publishes validated versions atomically and retains the previous version on failure. Changed interpretation is flagged for review; imports do not advance the editorial review date. Local broker studies and photographs retain their own dates.
SHA-256: cf1ac2ab12236da3e05a81d06542e6fb95581704c6e9f375424e73b72ccb444b
Investment judgments are RentalCalcs’ analysis of the stated evidence. Purchase examples are explicitly assumed underwriting cases, not listings, appraisals, financing quotes or observed market cap rates. Report a correction.