
How much is rent in Texas?
The $1,573 median describes the middle tracked ZIP index, not the rent paid by a typical Texas household. Each ZIP gets one vote, regardless of its rental population. The $1,605 mean is the sum of these ZIP indices divided by 752; high values pull it upward.
These are derived from Zillow’s smoothed all-home Observed Rent Index (ZORI). Zillow weights observations within its index; this page then weights ZIP indices equally. It is neither Zillow’s official Texas series nor a bedroom-specific apartment average.
Investment research · reviewed October 20, 2026
Austin’s apartment move-ins exceed new deliveries; Houston and San Antonio still have a delivery gap
Texas’s major apartment markets share rent pressure, but they are at different points in the supply cycle. The useful investment distinction is whether recent move-ins are catching up with deliveries, and whether collected rent can carry the property while that adjustment continues.
Underwriting conclusion. Investigate Austin recovery selectively, require a larger lease-up cushion in Houston and San Antonio, and verify competing deliveries in DFW. None of these broad apartment readings justifies importing an institutional rent or vacancy assumption into a single-family rental.
Read the table across both measures: annual rent change and the ratio of move-ins to completions. A ratio below 1.0× means deliveries exceeded net absorption; a positive rent change does not remove that imbalance.
| Provider market | Net absorption | Completions | Absorption / completions | Reported occupancy | Annual rent change |
|---|---|---|---|---|---|
| Austin | 19,522 | 12,726 | 1.53× | 89.8% | -4.2% |
| Dallas–Fort Worth | 26,219 | 28,232 | 0.93× | 90.1% | -2.8% |
| Houston | 9,307 | 16,210 | 0.57× | 88.7% | -2.3% |
| San Antonio | 3,497 | 6,284 | 0.56× | 86.0% | -5.4% |
Sources: linked MMG original market reports, accessed October 20, 2026. Absorption and completions are apartments over four quarters; rent change is annual, occupancy follows each provider report’s stated cohort. The ratio is our calculation, not a published absorption rate, causal estimate or forecast. Provider cohorts/geographies can differ from ZIP, Census and small-building samples; none of these values updates or replaces the shared ZIP rent table. Read each market thesis below before using the relationship.
The interpretations and conditional actions below are RentalCalcs editorial analysis. Source observations keep their own periods. They do not establish a purchase recommendation, a property’s permitted rent or current leasing results.
Austin
Absorption exceeds completions, but the recovery has not restored year-ago rent
MMG’s Q2 2026 apartment report records 19,522 units absorbed versus 12,726 completed over four quarters. Occupancy was 89.8%, and effective rents remained 4.2% below a year earlier despite a 2.0% quarterly gain.
- MMG Austin Q2 2026 apartment report · Q2 2026; absorption and completions cover trailing four quarters · accessed October 20, 2026.
That combination supports a recovery investigation rather than a stabilized-rent assumption. Demand is working through existing supply; the landlord may still need concessions to secure a tenant today. The same report lists 15,174 units under construction, so less construction is not zero competition.
Investment action. For an acquisition near lease-up projects, obtain current signed effective rents and a competing-delivery schedule. Price the first year on those terms, then test a renewal without the incentive as upside. A seller’s restored-rent scenario should not fund debt service before the leases support it.
What would change the conclusion. If concessions and vacant comparable units continue to fall, recovery could be faster. Weak hiring or a concentrated local delivery cluster can interrupt it. These are Q2 provider observations, not an October property vacancy reading.
Records to obtain. Lease abstracts showing face rent and incentives, traffic-to-lease conversion, aged vacancy, completion dates and lender reserves.

Austin’s downtown towers provide location context for the apartment supply cycle. They do not describe the competitors of every suburban apartment or rental house.
2022 · Ryan Friesen · Original photograph · CC BY-SA 4.0. Proportionally resized and converted to WebP; no scene changes. Archival location context.
Dallas–Fort Worth
Near balance in annual move-ins still leaves a substantial construction pipeline
MMG reports 26,219 absorbed units against 28,232 completions over four quarters, 90.1% occupancy and a 2.8% annual effective-rent decline in Q2. The report lists 30,545 units under construction.
- MMG Dallas–Fort Worth Q2 2026 apartment report · Q2 2026; absorption and completions cover trailing four quarters · accessed October 20, 2026.
A small annual delivery gap compared with the scale of this market does not identify where the remaining construction lands. A mature neighborhood rental and a new apartment beside several lease-ups can have different pricing power.
Investment action. Map actual competitors for the unit type and commute shed, verify their delivery dates and incentives, and underwrite a longer first lease at today’s collected rent. For a house, replace apartment evidence with matching house leases rather than transferring the 90.1% occupancy reading.
What would change the conclusion. Successful absorption of the remaining pipeline can improve future pricing. A new local cluster or a unit with weak differentiation can prolong discounts. A metro-wide rent recovery is insufficient evidence of subject performance.
Records to obtain. Submarket pipeline, executed comparable leases, tax estimates for the buyer, insurance and recurring maintenance.
Houston
The delivery gap argues for underwriting collections before rent growth
MMG’s Q2 report shows 16,210 completions and 9,307 absorbed units over four quarters. Occupancy was 88.7% and annual effective rent was down 2.3%, although quarterly absorption improved.
- MMG Houston Q2 2026 apartment report · Q2 2026; absorption and completions cover trailing four quarters · accessed October 20, 2026.
The annual supply/demand imbalance means a positive leasing quarter is not sufficient evidence that all existing vacancy has cleared. Buying on a high face-rent projection can hide both concessions and units that are not collecting.
Investment action. Stress economic collections and current incentives before adding a growth assumption. Obtain address-specific flood history, insurance terms and applicable tax districts alongside the rent roll; the market report measures none of those property costs. Consider a lower basis or less debt if the downside requires the recovery to arrive on schedule.
What would change the conclusion. A small local pipeline and demonstrated tenant retention may outperform the aggregate. Conversely, uninsured exposures or a weaker competitive position can overwhelm a modest rent improvement.
Records to obtain. Collected-rent ledger, lease incentives, flood disclosures/diligence, bindable insurance and buyer tax estimate.
San Antonio
Low occupancy makes a fast rent rebound an especially weak acquisition assumption
MMG lists 86.0% occupancy, a 5.4% annual effective-rent decline, and 6,284 completions against 3,497 absorbed units over four quarters in Q2 2026. Quarterly occupancy stopped falling, but the annual imbalance remained.
- MMG San Antonio Q2 2026 apartment report · Q2 2026; absorption and completions cover trailing four quarters · accessed October 20, 2026.
A pause in deterioration is useful evidence; it is not the same as restored pricing power. A low purchase price relative to yesterday’s rents can still be expensive relative to today’s effective income.
Investment action. For a property competing with this apartment segment, require verified recent collections and fund a slower recovery case. Evaluate whether the current rent position is competitive without repeated incentives. Prioritize a sustainable rent roll over a business plan whose returns depend on quick mark-to-market increases.
What would change the conclusion. The shrinking pipeline could eventually relieve pressure; proven occupancy and fewer competing deliveries can improve a specific deal. We do not assume all San Antonio rental types share the provider’s apartment occupancy.
Records to obtain. Aged vacancy and concessions, collections, lease expirations, delivery calendar and lender lease-up requirements.
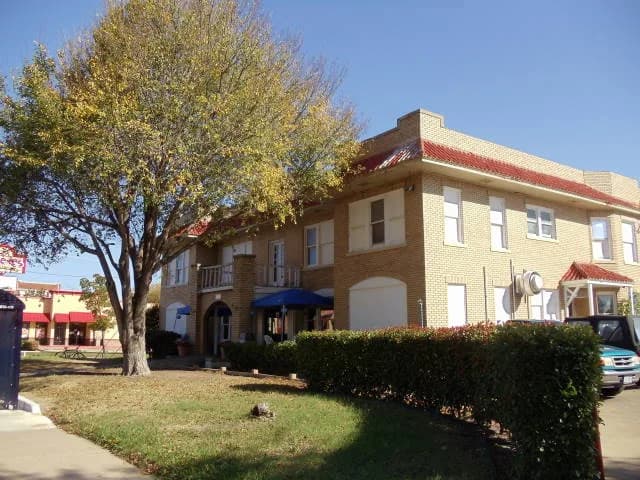
Dallas: an older apartment’s condition, service level and lease terms may differ from the new projects counted in the pipeline. Match the competitive set before importing a rent assumption.
November 26, 2011 · Renelibrary · Original photograph · CC BY-SA 3.0. Proportionally resized and converted to WebP; no scene changes. Archival location context.
For the purchase-price side, use the texas cap-rate research with its own transaction dates and property cohorts. A cap rate from another sample should not be multiplied by this page’s ZIP index to value a property.
A Texas lease-up must carry debt on collected rent, after the incentive
The Q2 reports show why headline rents and income diverge during a supply correction. This invented per-apartment budget uses a one-month incentive as a stress assumption, not a measured Texas-wide offer. It applies the incentive only to the occupied share, then deducts the full annual expense, debt and reserve budget.
Illustration · one apartment · first 12 months · USD. Editable assumptions, not observed market averages or an acquisition recommendation. All recurring amounts are allocated per apartment. No appreciation, sale proceeds or tax benefits are assumed.
Annual cash after operating costs, debt and reserve contribution
$450This is a positive illustration margin, before initial capital work, income tax and sale costs.
- Scheduled rent
- $18,000
- − Vacancy / noncollection
- -$1,800
- − Occupied-share concession
- -$1,350
- = Effective rental income
- $14,850
- − Operating expenses
- -$7,000
- = NOI before debt / reserves
- $7,850
- − Debt service
- -$6,500
- − Reserve contribution
- -$900
- = Annual cash margin
- $450
NOI excludes debt service and this worksheet’s reserve contribution. Initial renovation, acquisition costs and initial downtime are outside this annual operating illustration. Do not subtract the same vacancy, incentive or repair expense twice.
On a narrow screen, scroll the table sideways to compare all three expense budgets.
| Collected occupancy | Entered expenses | Expenses +10% | Expenses +20% |
|---|---|---|---|
| 95% | $1,275Cash remaining | $575Cash remaining | -$125Cash deficit |
| 90% | $450Cash remaining | -$250Cash deficit | -$950Cash deficit |
| 85% | -$375Cash deficit | -$1,075Cash deficit | -$1,775Cash deficit |
Occupancy here is the collected share of scheduled rent before incentives, not a count of occupied doors. At the entered costs, break-even collected occupancy is 87.3%. Debt-service coverage is 1.21× NOI / debt service; it excludes reserve contributions.
A property that needs the incentive removed immediately to cover debt has little cushion for a slower lease-up. Price that execution risk explicitly. Do not import the worksheet’s assumptions into a house, accept a seller’s tax bill as the buyer’s forecast, or treat a reserve contribution as an operating expense inside NOI.
Use the full property cash-flow calculator for the purchase price, financing terms and holding period. Review its expense and reserve conventions before transferring assumptions; this illustration does not automatically populate a deal.
ZIP-index medians in seven Texas county sets
The Austin–San Antonio corridor gap is $206 per month, or $2,466 annualized. Dallas–Fort Worth and Houston differ by $14 per month in these selected county sets. These are geographic comparisons of ZIP indices, not moving savings or equivalent homes.
Scroll the table sideways for all columns on a narrow screen.
| Comparison area | ZIP median / month | ZIP mean / month | ZIP count |
|---|---|---|---|
| Dallas–Fort Worth core | $1,684 | $1,745 | 190 |
| Houston core + nearby counties | $1,670 | $1,652 | 180 |
| Austin corridor | $1,667 | $1,812 | 63 |
| San Antonio corridor | $1,462 | $1,470 | 68 |
| El Paso County | $1,326 | $1,419 | 17 |
| Lower Rio Grande Valley | $1,253 | $1,395 | 22 |
| Midland + Odessa counties | $1,552 | $1,575 | 9 |
752 eligible ZIPs share September 2026; 0 eligible observations fall outside that month. Dollars are rounded only for display; annual gaps use unrounded medians. These selected areas do not cover all Texas counties.
DFW, Houston, Austin and San Antonio ZIP comparisons
- DFW and Houston nearly tie at the middle. Their ZIP medians differ by only $14, rounded, while their means differ by $93. Higher ZIP values influence the mean differently. A claim that one whole area is cheaper would conceal that distribution.
- The Austin comparison depends on the alternative. Its corridor median is $206 above San Antonio’s, but close to the DFW and Houston cuts. Compare the same home type and bedroom count before attributing the gap to location.
- Small western samples require more local work. Midland and Ector counties contribute only 9 eligible ZIPs. That is a reference for a comp search, not a representative price for every home across the Permian Basin.
Which counties are included?
- Dallas–Fort Worth core: Dallas, Tarrant, Collin, Denton.
- Houston core + nearby counties: Harris, Fort Bend, Montgomery, Brazoria, Galveston.
- Austin corridor: Travis, Williamson, Hays.
- San Antonio corridor: Bexar, Comal, Guadalupe.
- El Paso County: El Paso.
- Lower Rio Grande Valley: Cameron, Hidalgo, Willacy.
- Midland + Odessa counties: Midland, Ector.
These analyst-selected whole-county sets are not official MSAs or the Comptroller’s 12 economic regions. Use the Texas Comptroller regional reports for that separate geography. County assignments describe the source ZIP, not an address boundary match.
The border and Permian Basin need their own comparison
El Paso, the Lower Rio Grande Valley and Midland–Odessa are separate cuts here. A single “West Texas” number would hide both geography and housing mix. Small samples can swing with one ZIP; inspect their counts before comparing them with the large corridors. None is ranked for safety, suitability or investment returns.
Find the city, then inspect its ZIP spread
City groups follow the source’s postal-city labels. They are narrower than the county comparisons above and do not necessarily match municipal boundaries. Austin’s city group and the three-county Austin corridor answer different questions.
46 matching cities. Preview ordered by tracked ZIP count, then name; not by affordability. Scroll the table sideways for all columns.
| Postal city | ZIP median / month | ZIP mean / month | ZIPs | Observation months |
|---|---|---|---|---|
| Houston | $1,546 | $1,554 | 94 | September 2026 |
| San Antonio | $1,393 | $1,427 | 53 | September 2026 |
| Dallas | $1,574 | $1,646 | 43 | September 2026 |
| Austin | $1,637 | $1,801 | 40 | September 2026 |
| Fort Worth | $1,591 | $1,581 | 27 | September 2026 |
| El Paso | $1,311 | $1,404 | 16 | September 2026 |
| Arlington | $1,602 | $1,678 | 13 | September 2026 |
| Lubbock | $1,210 | $1,184 | 13 | September 2026 |
View remaining 38 cities
| Postal city | ZIP median / month | ZIP mean / month | ZIPs | Observation months |
|---|---|---|---|---|
| Corpus Christi | $1,415 | $1,420 | 10 | September 2026 |
| Amarillo | $1,428 | $1,406 | 8 | September 2026 |
| Spring | $1,770 | $1,870 | 8 | September 2026 |
| Conroe | $1,669 | $1,701 | 7 | September 2026 |
| Waco | $1,363 | $1,379 | 7 | September 2026 |
| Beaumont | $1,302 | $1,284 | 6 | September 2026 |
| Irving | $1,498 | $1,552 | 6 | September 2026 |
| Plano | $1,731 | $1,799 | 6 | September 2026 |
| Wichita Falls | $1,305 | $1,331 | 6 | September 2026 |
| Abilene | $2,044 | $2,004 | 5 | September 2026 |
| Denton | $1,393 | $1,442 | 5 | September 2026 |
| Garland | $1,506 | $1,584 | 5 | September 2026 |
| Laredo | $1,086 | $1,078 | 5 | September 2026 |
| Midland | $1,552 | $1,569 | 5 | September 2026 |
| Pasadena | $1,331 | $1,383 | 5 | September 2026 |
| Tyler | $1,359 | $1,417 | 5 | September 2026 |
| Bryan | $1,468 | $1,449 | 4 | September 2026 |
| Frisco | $2,100 | $2,070 | 4 | September 2026 |
| Grand Prairie | $1,617 | $1,752 | 4 | September 2026 |
| Katy | $1,835 | $1,908 | 4 | September 2026 |
| Killeen | $1,272 | $1,216 | 4 | September 2026 |
| Longview | $1,171 | $1,178 | 4 | September 2026 |
| McKinney | $1,852 | $1,906 | 4 | September 2026 |
| Odessa | $1,598 | $1,583 | 4 | September 2026 |
| Baytown | $1,547 | $1,591 | 3 | September 2026 |
| Brownsville | $1,609 | $1,676 | 3 | September 2026 |
| Carrollton | $1,767 | $1,694 | 3 | September 2026 |
| Edinburg | $1,119 | $1,087 | 3 | September 2026 |
| Galveston | $1,509 | $1,771 | 3 | September 2026 |
| Georgetown | $1,680 | $1,648 | 3 | September 2026 |
| McAllen | $1,251 | $1,373 | 3 | September 2026 |
| Mesquite | $1,835 | $1,917 | 3 | September 2026 |
| Richardson | $1,652 | $1,680 | 3 | September 2026 |
| Round Rock | $1,691 | $1,702 | 3 | September 2026 |
| San Angelo | $1,254 | $1,246 | 3 | September 2026 |
| Sugar Land | $1,872 | $1,944 | 3 | September 2026 |
| Temple | $1,355 | $1,400 | 3 | September 2026 |
| Weatherford | $1,588 | $1,566 | 3 | September 2026 |
Source: shared eligible Zillow ZIP indices. Only groups meeting the existing three-ZIP publication threshold receive a city page. A large ZIP count is coverage, not evidence that rents are affordable.
Metro rent research
Read local rent trends, property strategies and acquisition downside analysis for each metro. Markets that span several states have one report.
- Corpus Christi metro · TX
Test project-lease income and the cash needed to repair a coastal rental before final insurance reimbursement.
- Midland metro · TX
Measure payer concentration and service-adjusted income after an employer exit before paying for corporate lease premiums.
- Killeen–Temple metro · TX
Compare concession recovery over the established rent-owed term, then fund the separate military move-out turn.
Search Texas ZIP rent benchmarks
Find a ZIP or postal city and narrow by source county. An absent ZIP is missing coverage, not a zero-dollar rent. The complete eligible sample is available in the expandable table.
Newest included observation: September 2026. Historical retained ZIPs are excluded from current estimates after a validated refresh.
752 matching ZIPs, ordered by ZIP. Preview shows up to six. Scroll the table sideways for all columns.
| ZIP | Postal city | County | Monthly index | Observation |
|---|---|---|---|---|
| 75001 | Addison | Dallas County | $1,592 | September 2026 |
| 75002 | Allen | Collin County | $2,175 | September 2026 |
| 75006 | Carrollton | Dallas County | $1,501 | September 2026 |
| 75007 | Carrollton | Denton County | $1,813 | September 2026 |
| 75009 | Celina | Collin County | $1,989 | September 2026 |
| 75010 | Carrollton | Denton County | $1,767 | September 2026 |
View remaining 746 ZIP benchmarks
| ZIP | Postal city | County | Monthly index | Observation |
|---|---|---|---|---|
| 75013 | Allen | Collin County | $1,640 | September 2026 |
| 75019 | Coppell | Dallas County | $2,153 | September 2026 |
| 75020 | Denison | Grayson County | $1,412 | September 2026 |
| 75021 | Denison | Grayson County | $1,449 | September 2026 |
| 75022 | Flower Mound | Denton County | $2,547 | September 2026 |
| 75023 | Plano | Collin County | $1,894 | September 2026 |
| 75024 | Plano | Collin County | $1,777 | September 2026 |
| 75025 | Plano | Collin County | $2,167 | September 2026 |
| 75028 | Flower Mound | Denton County | $2,329 | September 2026 |
| 75032 | Rockwall | Rockwall County | $1,808 | September 2026 |
| 75033 | Frisco | Denton County | $1,840 | September 2026 |
| 75034 | Frisco | Collin County | $1,688 | September 2026 |
| 75035 | Frisco | Collin County | $2,390 | September 2026 |
| 75036 | Frisco | Denton County | $2,360 | September 2026 |
| 75038 | Irving | Dallas County | $1,357 | September 2026 |
| 75039 | Irving | Dallas County | $1,932 | September 2026 |
| 75040 | Garland | Dallas County | $1,832 | September 2026 |
| 75041 | Garland | Dallas County | $1,490 | September 2026 |
| 75042 | Garland | Dallas County | $1,592 | September 2026 |
| 75043 | Garland | Dallas County | $1,501 | September 2026 |
| 75044 | Garland | Dallas County | $1,506 | September 2026 |
| 75048 | Sachse | Dallas County | $1,699 | September 2026 |
| 75050 | Grand Prairie | Dallas County | $1,468 | September 2026 |
| 75051 | Grand Prairie | Dallas County | $1,517 | September 2026 |
| 75052 | Grand Prairie | Dallas County | $1,717 | September 2026 |
| 75054 | Grand Prairie | Tarrant County | $2,307 | September 2026 |
| 75056 | The Colony | Denton County | $1,732 | September 2026 |
| 75057 | Lewisville | Denton County | $1,618 | September 2026 |
| 75058 | Gunter | Grayson County | $1,395 | September 2026 |
| 75060 | Irving | Dallas County | $1,693 | September 2026 |
| 75061 | Irving | Dallas County | $1,332 | September 2026 |
| 75062 | Irving | Dallas County | $1,469 | September 2026 |
| 75063 | Irving | Dallas County | $1,526 | September 2026 |
| 75065 | Lake Dallas | Denton County | $1,947 | September 2026 |
| 75067 | Lewisville | Denton County | $1,382 | September 2026 |
| 75068 | Little Elm | Denton County | $2,317 | September 2026 |
| 75069 | McKinney | Collin County | $1,507 | September 2026 |
| 75070 | McKinney | Collin County | $1,643 | September 2026 |
| 75071 | McKinney | Collin County | $2,061 | September 2026 |
| 75072 | McKinney | Collin County | $2,411 | September 2026 |
| 75074 | Plano | Collin County | $1,663 | September 2026 |
| 75075 | Plano | Collin County | $1,608 | September 2026 |
| 75077 | Highland Village | Denton County | $1,785 | September 2026 |
| 75078 | Prosper | Collin County | $2,041 | September 2026 |
| 75080 | Richardson | Dallas County | $1,780 | September 2026 |
| 75081 | Richardson | Dallas County | $1,607 | September 2026 |
| 75082 | Richardson | Collin County | $1,652 | September 2026 |
| 75087 | Rockwall | Rockwall County | $1,820 | September 2026 |
| 75088 | Rowlett | Dallas County | $1,674 | September 2026 |
| 75089 | Rowlett | Dallas County | $1,573 | September 2026 |
| 75090 | Sherman | Grayson County | $1,395 | September 2026 |
| 75092 | Sherman | Grayson County | $1,215 | September 2026 |
| 75093 | Plano | Collin County | $1,684 | September 2026 |
| 75094 | Murphy | Collin County | $3,048 | September 2026 |
| 75098 | Wylie | Collin County | $1,874 | September 2026 |
| 75104 | Cedar Hill | Dallas County | $1,823 | September 2026 |
| 75110 | Corsicana | Navarro County | $1,292 | September 2026 |
| 75114 | Crandall | Kaufman County | $1,837 | September 2026 |
| 75115 | Desoto | Dallas County | $2,118 | September 2026 |
| 75116 | Duncanville | Dallas County | $1,491 | September 2026 |
| 75119 | Ennis | Ellis County | $1,693 | September 2026 |
| 75126 | Forney | Kaufman County | $2,085 | September 2026 |
| 75134 | Lancaster | Dallas County | $2,252 | September 2026 |
| 75137 | Duncanville | Dallas County | $1,686 | September 2026 |
| 75142 | Kaufman | Kaufman County | $1,381 | September 2026 |
| 75146 | Lancaster | Dallas County | $2,227 | September 2026 |
| 75147 | Mabank | Van Zandt County | $1,725 | September 2026 |
| 75149 | Mesquite | Dallas County | $1,835 | September 2026 |
| 75150 | Mesquite | Dallas County | $1,297 | September 2026 |
| 75154 | Red Oak | Ellis County | $2,369 | September 2026 |
| 75159 | Seagoville | Dallas County | $1,989 | September 2026 |
| 75160 | Terrell | Kaufman County | $1,571 | September 2026 |
| 75165 | Waxahachie | Ellis County | $1,787 | September 2026 |
| 75166 | Lavon | Collin County | $1,958 | September 2026 |
| 75180 | Balch Springs | Dallas County | $1,646 | September 2026 |
| 75181 | Mesquite | Dallas County | $2,619 | September 2026 |
| 75189 | Royse City | Rockwall County | $2,056 | September 2026 |
| 75201 | Dallas | Dallas County | $2,320 | September 2026 |
| 75202 | Dallas | Dallas County | $2,324 | September 2026 |
| 75203 | Dallas | Dallas County | $1,541 | September 2026 |
| 75204 | Dallas | Dallas County | $2,084 | September 2026 |
| 75205 | Highland Park | Dallas County | $2,906 | September 2026 |
| 75206 | Dallas | Dallas County | $2,046 | September 2026 |
| 75207 | Dallas | Dallas County | $1,658 | September 2026 |
| 75208 | Dallas | Dallas County | $1,574 | September 2026 |
| 75209 | Dallas | Dallas County | $1,969 | September 2026 |
| 75210 | Dallas | Dallas County | $1,324 | September 2026 |
| 75211 | Cockrell Hill | Dallas County | $1,469 | September 2026 |
| 75212 | Dallas | Dallas County | $1,612 | September 2026 |
| 75214 | Dallas | Dallas County | $1,529 | September 2026 |
| 75215 | Dallas | Dallas County | $1,539 | September 2026 |
| 75216 | Dallas | Dallas County | $1,852 | September 2026 |
| 75217 | Dallas | Dallas County | $1,521 | September 2026 |
| 75218 | Dallas | Dallas County | $1,788 | September 2026 |
| 75219 | Dallas | Dallas County | $2,085 | September 2026 |
| 75220 | Dallas | Dallas County | $1,309 | September 2026 |
| 75223 | Dallas | Dallas County | $2,118 | September 2026 |
| 75224 | Dallas | Dallas County | $1,413 | September 2026 |
| 75225 | University Park | Dallas County | $2,927 | September 2026 |
| 75226 | Dallas | Dallas County | $1,583 | September 2026 |
| 75227 | Dallas | Dallas County | $1,702 | September 2026 |
| 75228 | Dallas | Dallas County | $1,428 | September 2026 |
| 75229 | Dallas | Dallas County | $2,265 | September 2026 |
| 75230 | Dallas | Dallas County | $1,445 | September 2026 |
| 75231 | Dallas | Dallas County | $1,340 | September 2026 |
| 75232 | Dallas | Dallas County | $1,861 | September 2026 |
| 75233 | Dallas | Dallas County | $1,487 | September 2026 |
| 75234 | Farmers Branch | Dallas County | $1,618 | September 2026 |
| 75235 | Dallas | Dallas County | $1,554 | September 2026 |
| 75236 | Dallas | Dallas County | $1,514 | September 2026 |
| 75237 | Dallas | Dallas County | $1,232 | September 2026 |
| 75238 | Dallas | Dallas County | $1,196 | September 2026 |
| 75240 | Dallas | Dallas County | $1,594 | September 2026 |
| 75241 | Dallas | Dallas County | $1,729 | September 2026 |
| 75243 | Dallas | Dallas County | $1,076 | September 2026 |
| 75244 | Farmers Branch | Dallas County | $1,869 | September 2026 |
| 75246 | Dallas | Dallas County | $1,253 | September 2026 |
| 75247 | Dallas | Dallas County | $1,849 | September 2026 |
| 75248 | Dallas | Dallas County | $1,431 | September 2026 |
| 75249 | Dallas | Dallas County | $2,268 | September 2026 |
| 75251 | Dallas | Dallas County | $1,603 | September 2026 |
| 75252 | Dallas | Collin County | $1,213 | September 2026 |
| 75253 | Dallas | Dallas County | $1,979 | September 2026 |
| 75254 | Dallas | Dallas County | $1,320 | September 2026 |
| 75287 | Dallas | Collin County | $1,238 | September 2026 |
| 75401 | Greenville | Hunt County | $1,501 | September 2026 |
| 75402 | Greenville | Hunt County | $1,573 | September 2026 |
| 75407 | Princeton | Collin County | $1,970 | September 2026 |
| 75409 | Anna | Collin County | $1,796 | September 2026 |
| 75418 | Bonham | Fannin County | $1,535 | September 2026 |
| 75428 | Commerce | Hunt County | $1,166 | September 2026 |
| 75442 | Farmersville | Collin County | $1,610 | September 2026 |
| 75454 | Melissa | Collin County | $1,784 | September 2026 |
| 75455 | Mount Pleasant | Titus County | $1,592 | September 2026 |
| 75460 | Paris | Lamar County | $1,339 | September 2026 |
| 75474 | Quinlan | Hunt County | $1,573 | September 2026 |
| 75482 | Sulphur Springs | Hopkins County | $1,639 | September 2026 |
| 75495 | Van Alstyne | Grayson County | $1,901 | September 2026 |
| 75501 | Texarkana | Bowie County | $992 | September 2026 |
| 75503 | Texarkana | Bowie County | $1,511 | September 2026 |
| 75601 | Longview | Gregg County | $1,336 | September 2026 |
| 75602 | Longview | Gregg County | $1,184 | September 2026 |
| 75604 | Longview | Gregg County | $1,036 | September 2026 |
| 75605 | Longview | Gregg County | $1,157 | September 2026 |
| 75647 | Gladewater | Gregg County | $998 | September 2026 |
| 75701 | Tyler | Smith County | $1,292 | September 2026 |
| 75702 | Tyler | Smith County | $1,359 | September 2026 |
| 75703 | Tyler | Smith County | $1,203 | September 2026 |
| 75704 | Tyler | Smith County | $1,384 | September 2026 |
| 75707 | Tyler | Smith County | $1,848 | September 2026 |
| 75751 | Athens | Henderson County | $1,305 | September 2026 |
| 75757 | Bullard | Cherokee County | $1,688 | September 2026 |
| 75762 | Flint | Smith County | $1,763 | September 2026 |
| 75771 | Lindale | Smith County | $1,406 | September 2026 |
| 75773 | Mineola | Wood County | $1,275 | September 2026 |
| 75791 | Whitehouse | Smith County | $1,643 | September 2026 |
| 75801 | Palestine | Anderson County | $1,440 | September 2026 |
| 75901 | Lufkin | Angelina County | $1,429 | September 2026 |
| 75904 | Lufkin | Angelina County | $1,330 | September 2026 |
| 76001 | Arlington | Tarrant County | $2,144 | September 2026 |
| 76002 | Arlington | Tarrant County | $2,190 | September 2026 |
| 76005 | Arlington | Tarrant County | $2,200 | September 2026 |
| 76006 | Arlington | Tarrant County | $1,202 | September 2026 |
| 76008 | Aledo | Parker County | $2,349 | September 2026 |
| 76009 | Alvarado | Johnson County | $1,717 | September 2026 |
| 76010 | Arlington | Tarrant County | $1,182 | September 2026 |
| 76011 | Arlington | Tarrant County | $1,372 | September 2026 |
| 76012 | Arlington | Tarrant County | $1,412 | September 2026 |
| 76013 | Arlington | Tarrant County | $1,358 | September 2026 |
| 76014 | Arlington | Tarrant County | $1,411 | September 2026 |
| 76015 | Arlington | Tarrant County | $1,602 | September 2026 |
| 76016 | Arlington | Tarrant County | $1,848 | September 2026 |
| 76017 | Arlington | Tarrant County | $1,937 | September 2026 |
| 76018 | Arlington | Tarrant County | $1,962 | September 2026 |
| 76020 | Azle | Parker County | $1,764 | September 2026 |
| 76021 | Bedford | Tarrant County | $1,295 | September 2026 |
| 76022 | Bedford | Tarrant County | $1,383 | September 2026 |
| 76028 | Burleson | Johnson County | $1,694 | September 2026 |
| 76031 | Cleburne | Johnson County | $1,815 | September 2026 |
| 76033 | Cleburne | Johnson County | $1,369 | September 2026 |
| 76034 | Colleyville | Tarrant County | $3,332 | September 2026 |
| 76036 | Crowley | Tarrant County | $2,037 | September 2026 |
| 76039 | Euless | Tarrant County | $1,621 | September 2026 |
| 76040 | Euless | Tarrant County | $1,451 | September 2026 |
| 76044 | Godley | Johnson County | $2,000 | September 2026 |
| 76048 | Granbury | Hood County | $1,442 | September 2026 |
| 76049 | Granbury | Hood County | $2,038 | September 2026 |
| 76051 | Grapevine | Tarrant County | $1,732 | September 2026 |
| 76052 | Haslet | Tarrant County | $2,094 | September 2026 |
| 76053 | Hurst | Tarrant County | $1,368 | September 2026 |
| 76054 | Hurst | Tarrant County | $2,375 | September 2026 |
| 76058 | Joshua | Johnson County | $1,824 | September 2026 |
| 76060 | Kennedale | Tarrant County | $1,370 | September 2026 |
| 76063 | Mansfield | Tarrant County | $1,706 | September 2026 |
| 76065 | Midlothian | Ellis County | $1,897 | September 2026 |
| 76067 | Mineral Wells | Palo Pinto County | $1,328 | September 2026 |
| 76078 | Rhome | Wise County | $2,097 | September 2026 |
| 76082 | Springtown | Parker County | $1,821 | September 2026 |
| 76084 | Venus | Johnson County | $1,929 | September 2026 |
| 76086 | Weatherford | Parker County | $1,433 | September 2026 |
| 76087 | Weatherford | Parker County | $1,676 | September 2026 |
| 76088 | Weatherford | Parker County | $1,588 | September 2026 |
| 76102 | Fort Worth | Tarrant County | $1,579 | September 2026 |
| 76103 | Fort Worth | Tarrant County | $1,434 | September 2026 |
| 76104 | Fort Worth | Tarrant County | $1,509 | September 2026 |
| 76105 | Fort Worth | Tarrant County | $1,591 | September 2026 |
| 76106 | Fort Worth | Tarrant County | $1,288 | September 2026 |
| 76107 | Fort Worth | Tarrant County | $1,606 | September 2026 |
| 76108 | Fort Worth | Tarrant County | $1,810 | September 2026 |
| 76109 | Fort Worth | Tarrant County | $1,765 | September 2026 |
| 76110 | Fort Worth | Tarrant County | $1,717 | September 2026 |
| 76111 | Fort Worth | Tarrant County | $1,479 | September 2026 |
| 76112 | Fort Worth | Tarrant County | $1,281 | September 2026 |
| 76114 | River Oaks | Tarrant County | $1,744 | September 2026 |
| 76115 | Fort Worth | Tarrant County | $1,690 | September 2026 |
| 76116 | Fort Worth | Tarrant County | $1,226 | September 2026 |
| 76117 | Haltom City | Tarrant County | $1,123 | September 2026 |
| 76118 | Fort Worth | Tarrant County | $1,791 | September 2026 |
| 76119 | Fort Worth | Tarrant County | $1,125 | September 2026 |
| 76120 | Fort Worth | Tarrant County | $1,258 | September 2026 |
| 76123 | Fort Worth | Tarrant County | $1,887 | September 2026 |
| 76126 | Benbrook | Tarrant County | $1,894 | September 2026 |
| 76131 | Saginaw | Tarrant County | $1,879 | September 2026 |
| 76132 | Fort Worth | Tarrant County | $1,202 | September 2026 |
| 76133 | Fort Worth | Tarrant County | $1,684 | September 2026 |
| 76134 | Fort Worth | Tarrant County | $1,706 | September 2026 |
| 76135 | Fort Worth | Tarrant County | $1,494 | September 2026 |
| 76137 | Fort Worth | Tarrant County | $1,574 | September 2026 |
| 76140 | Everman | Tarrant County | $1,948 | September 2026 |
| 76148 | Watauga | Tarrant County | $2,019 | September 2026 |
| 76155 | Fort Worth | Tarrant County | $1,474 | September 2026 |
| 76164 | Fort Worth | Tarrant County | $1,753 | September 2026 |
| 76177 | Fort Worth | Tarrant County | $1,598 | September 2026 |
| 76179 | Fort Worth | Tarrant County | $2,018 | September 2026 |
| 76180 | North Richland Hills | Tarrant County | $1,501 | September 2026 |
| 76182 | North Richland Hills | Tarrant County | $2,116 | September 2026 |
| 76201 | Denton | Denton County | $1,393 | September 2026 |
| 76205 | Denton | Denton County | $1,340 | September 2026 |
| 76207 | Denton | Denton County | $1,556 | September 2026 |
| 76208 | Denton | Denton County | $1,554 | September 2026 |
| 76209 | Denton | Denton County | $1,368 | September 2026 |
| 76210 | Corinth | Denton County | $1,797 | September 2026 |
| 76226 | Argyle | Denton County | $2,973 | September 2026 |
| 76227 | Aubrey | Denton County | $1,835 | September 2026 |
| 76234 | Decatur | Wise County | $1,402 | September 2026 |
| 76240 | Gainesville | Cooke County | $1,480 | September 2026 |
| 76244 | Fort Worth | Tarrant County | $2,141 | September 2026 |
| 76247 | Justin | Denton County | $2,119 | September 2026 |
| 76248 | Keller | Tarrant County | $2,026 | September 2026 |
| 76262 | Roanoke | Denton County | $1,662 | September 2026 |
| 76266 | Sanger | Denton County | $1,547 | September 2026 |
| 76301 | Wichita Falls | Wichita County | $995 | September 2026 |
| 76302 | Wichita Falls | Wichita County | $1,523 | September 2026 |
| 76306 | Wichita Falls | Wichita County | $1,367 | September 2026 |
| 76308 | Wichita Falls | Wichita County | $1,242 | September 2026 |
| 76309 | Wichita Falls | Wichita County | $1,100 | September 2026 |
| 76310 | Wichita Falls | Wichita County | $1,758 | September 2026 |
| 76354 | Burkburnett | Wichita County | $1,375 | September 2026 |
| 76401 | Stephenville | Erath County | $1,000 | September 2026 |
| 76426 | Chico | Wise County | $1,331 | September 2026 |
| 76501 | Temple | Bell County | $1,355 | September 2026 |
| 76502 | Temple | Bell County | $1,582 | September 2026 |
| 76504 | Temple | Bell County | $1,264 | September 2026 |
| 76513 | Belton | Bell County | $1,519 | September 2026 |
| 76522 | Copperas Cove | Coryell County | $1,196 | September 2026 |
| 76537 | Jarrell | Williamson County | $1,732 | September 2026 |
| 76541 | Killeen | Bell County | $878 | September 2026 |
| 76542 | Killeen | Bell County | $1,443 | September 2026 |
| 76543 | Killeen | Bell County | $1,179 | September 2026 |
| 76548 | Harker Heights | Bell County | $1,467 | September 2026 |
| 76549 | Killeen | Bell County | $1,365 | September 2026 |
| 76559 | Nolanville | Bell County | $1,560 | September 2026 |
| 76571 | Salado | Bell County | $1,973 | September 2026 |
| 76574 | Taylor | Williamson County | $1,806 | September 2026 |
| 76643 | Hewitt | McLennan County | $1,650 | September 2026 |
| 76645 | Hillsboro | Hill County | $1,398 | September 2026 |
| 76701 | Waco | McLennan County | $1,342 | September 2026 |
| 76704 | Waco | McLennan County | $1,418 | September 2026 |
| 76705 | Lacy-Lakeview | McLennan County | $1,246 | September 2026 |
| 76706 | Waco | McLennan County | $1,379 | September 2026 |
| 76707 | Waco | McLennan County | $1,330 | September 2026 |
| 76708 | Waco | McLennan County | $1,586 | September 2026 |
| 76710 | Waco | McLennan County | $1,234 | September 2026 |
| 76711 | Waco | McLennan County | $1,363 | September 2026 |
| 76712 | Woodway | McLennan County | $1,616 | September 2026 |
| 76901 | Mertzon | Tom Green County | $1,426 | September 2026 |
| 76903 | San Angelo | Tom Green County | $1,254 | September 2026 |
| 76904 | San Angelo | Tom Green County | $1,276 | September 2026 |
| 76905 | San Angelo | Tom Green County | $1,207 | September 2026 |
| 77002 | Houston | Harris County | $1,920 | September 2026 |
| 77003 | Houston | Harris County | $1,986 | September 2026 |
| 77004 | Houston | Harris County | $2,116 | September 2026 |
| 77005 | Houston | Harris County | $2,160 | September 2026 |
| 77006 | Houston | Harris County | $1,649 | September 2026 |
| 77007 | Houston | Harris County | $1,892 | September 2026 |
| 77008 | Houston | Harris County | $1,971 | September 2026 |
| 77009 | Houston | Harris County | $1,847 | September 2026 |
| 77010 | Houston | Harris County | $2,856 | September 2026 |
| 77011 | Houston | Harris County | $1,273 | September 2026 |
| 77012 | Houston | Harris County | $1,363 | September 2026 |
| 77013 | Houston | Harris County | $830 | September 2026 |
| 77014 | Houston | Harris County | $1,153 | September 2026 |
| 77015 | Houston | Harris County | $1,050 | September 2026 |
| 77016 | Houston | Harris County | $1,671 | September 2026 |
| 77017 | Houston | Harris County | $1,379 | September 2026 |
| 77018 | Houston | Harris County | $2,090 | September 2026 |
| 77019 | Houston | Harris County | $2,124 | September 2026 |
| 77020 | Houston | Harris County | $1,854 | September 2026 |
| 77021 | Houston | Harris County | $1,827 | September 2026 |
| 77022 | Houston | Harris County | $1,533 | September 2026 |
| 77023 | Houston | Harris County | $1,369 | September 2026 |
| 77024 | Houston | Harris County | $1,750 | September 2026 |
| 77025 | Houston | Harris County | $1,418 | September 2026 |
| 77026 | Houston | Harris County | $1,530 | September 2026 |
| 77027 | Houston | Harris County | $1,878 | September 2026 |
| 77028 | Houston | Harris County | $1,680 | September 2026 |
| 77029 | Jacinto City | Harris County | $1,478 | September 2026 |
| 77030 | Houston | Harris County | $1,633 | September 2026 |
| 77031 | Houston | Harris County | $1,588 | September 2026 |
| 77032 | Houston | Harris County | $1,384 | September 2026 |
| 77033 | Houston | Harris County | $1,725 | September 2026 |
| 77034 | Houston | Harris County | $1,030 | September 2026 |
| 77035 | Houston | Harris County | $1,167 | September 2026 |
| 77036 | Houston | Harris County | $934 | September 2026 |
| 77038 | Houston | Harris County | $1,772 | September 2026 |
| 77040 | Houston | Harris County | $1,333 | September 2026 |
| 77041 | Houston | Harris County | $1,639 | September 2026 |
| 77042 | Houston | Harris County | $1,185 | September 2026 |
| 77043 | Houston | Harris County | $1,655 | September 2026 |
| 77044 | Houston | Harris County | $1,859 | September 2026 |
| 77045 | Houston | Harris County | $1,681 | September 2026 |
| 77046 | Houston | Harris County | $1,443 | September 2026 |
| 77047 | Houston | Harris County | $1,934 | September 2026 |
| 77048 | Houston | Harris County | $1,749 | September 2026 |
| 77049 | Houston | Harris County | $1,401 | September 2026 |
| 77051 | Houston | Harris County | $1,781 | September 2026 |
| 77053 | Houston | Fort Bend County | $1,708 | September 2026 |
| 77054 | Houston | Harris County | $1,337 | September 2026 |
| 77055 | Houston | Harris County | $1,518 | September 2026 |
| 77056 | Houston | Harris County | $1,728 | September 2026 |
| 77057 | Houston | Harris County | $1,438 | September 2026 |
| 77058 | Houston | Harris County | $1,425 | September 2026 |
| 77060 | Houston | Harris County | $972 | September 2026 |
| 77061 | Houston | Harris County | $899 | September 2026 |
| 77062 | Houston | Harris County | $1,594 | September 2026 |
| 77063 | Houston | Harris County | $1,300 | September 2026 |
| 77064 | Houston | Harris County | $1,483 | September 2026 |
| 77065 | Houston | Harris County | $1,309 | September 2026 |
| 77066 | Houston | Harris County | $1,266 | September 2026 |
| 77067 | Houston | Harris County | $1,649 | September 2026 |
| 77068 | Houston | Harris County | $1,967 | September 2026 |
| 77069 | Houston | Harris County | $1,154 | September 2026 |
| 77070 | Houston | Harris County | $1,455 | September 2026 |
| 77071 | Houston | Harris County | $1,838 | September 2026 |
| 77072 | Houston | Harris County | $1,559 | September 2026 |
| 77073 | Houston | Harris County | $1,891 | September 2026 |
| 77074 | Houston | Harris County | $1,176 | September 2026 |
| 77075 | Houston | Harris County | $1,288 | September 2026 |
| 77076 | Houston | Harris County | $1,560 | September 2026 |
| 77077 | Houston | Harris County | $1,284 | September 2026 |
| 77078 | Houston | Harris County | $1,490 | September 2026 |
| 77079 | Houston | Harris County | $1,479 | September 2026 |
| 77080 | Houston | Harris County | $1,170 | September 2026 |
| 77081 | Houston | Harris County | $933 | September 2026 |
| 77082 | Houston | Harris County | $1,265 | September 2026 |
| 77083 | Houston | Harris County | $1,893 | September 2026 |
| 77084 | Houston | Harris County | $1,526 | September 2026 |
| 77085 | Houston | Harris County | $1,289 | September 2026 |
| 77086 | Houston | Harris County | $1,396 | September 2026 |
| 77087 | Houston | Harris County | $1,569 | September 2026 |
| 77088 | Houston | Harris County | $1,690 | September 2026 |
| 77089 | Houston | Harris County | $1,562 | September 2026 |
| 77090 | Houston | Harris County | $1,071 | September 2026 |
| 77091 | Houston | Harris County | $1,862 | September 2026 |
| 77092 | Houston | Harris County | $1,502 | September 2026 |
| 77093 | Houston | Harris County | $1,348 | September 2026 |
| 77094 | Houston | Harris County | $2,007 | September 2026 |
| 77095 | Houston | Harris County | $1,394 | September 2026 |
| 77096 | Houston | Harris County | $1,294 | September 2026 |
| 77098 | Houston | Harris County | $1,844 | September 2026 |
| 77099 | Houston | Harris County | $1,143 | September 2026 |
| 77301 | Conroe | Montgomery County | $1,587 | September 2026 |
| 77302 | Conroe | Montgomery County | $2,066 | September 2026 |
| 77303 | Conroe | Montgomery County | $1,707 | September 2026 |
| 77304 | Conroe | Montgomery County | $1,414 | September 2026 |
| 77306 | Conroe | Montgomery County | $1,669 | September 2026 |
| 77316 | Montgomery | Montgomery County | $1,802 | September 2026 |
| 77318 | Willis | Montgomery County | $1,886 | September 2026 |
| 77320 | Huntsville | Walker County | $1,264 | September 2026 |
| 77327 | Cleveland | Liberty County | $1,579 | September 2026 |
| 77328 | Cleveland | San Jacinto County | $1,807 | September 2026 |
| 77336 | Houston | Harris County | $1,862 | September 2026 |
| 77338 | Humble | Harris County | $1,518 | September 2026 |
| 77339 | Houston | Harris County | $1,590 | September 2026 |
| 77340 | Huntsville | Walker County | $1,403 | September 2026 |
| 77345 | Houston | Harris County | $2,066 | September 2026 |
| 77346 | Atascocita | Harris County | $1,814 | September 2026 |
| 77351 | Livingston | Polk County | $1,392 | September 2026 |
| 77354 | Magnolia | Montgomery County | $1,789 | September 2026 |
| 77355 | Magnolia | Montgomery County | $1,912 | September 2026 |
| 77356 | Montgomery | Montgomery County | $1,760 | September 2026 |
| 77357 | New Caney | Montgomery County | $1,836 | September 2026 |
| 77362 | Pinehurst | Montgomery County | $2,182 | September 2026 |
| 77365 | Porter | Montgomery County | $1,845 | September 2026 |
| 77373 | Spring | Harris County | $1,767 | September 2026 |
| 77375 | Tomball | Harris County | $1,679 | September 2026 |
| 77377 | Tomball | Harris County | $1,902 | September 2026 |
| 77378 | Willis | Montgomery County | $1,738 | September 2026 |
| 77379 | Spring | Harris County | $1,560 | September 2026 |
| 77380 | Spring | Montgomery County | $1,773 | September 2026 |
| 77381 | Spring | Montgomery County | $2,135 | September 2026 |
| 77382 | Spring | Montgomery County | $2,175 | September 2026 |
| 77384 | Conroe | Montgomery County | $1,568 | September 2026 |
| 77385 | Conroe | Montgomery County | $1,895 | September 2026 |
| 77386 | Spring | Montgomery County | $2,105 | September 2026 |
| 77388 | Spring | Harris County | $1,692 | September 2026 |
| 77389 | Spring | Harris County | $1,754 | September 2026 |
| 77396 | Humble | Harris County | $1,555 | September 2026 |
| 77401 | Bellaire | Harris County | $2,749 | September 2026 |
| 77406 | Richmond | Fort Bend County | $1,804 | September 2026 |
| 77407 | Richmond | Fort Bend County | $1,716 | September 2026 |
| 77414 | Bay City | Matagorda County | $851 | September 2026 |
| 77422 | Brazoria | Brazoria County | $1,545 | September 2026 |
| 77423 | Pattison | Waller County | $1,909 | September 2026 |
| 77429 | Cypress | Harris County | $1,862 | September 2026 |
| 77433 | Cypress | Harris County | $1,964 | September 2026 |
| 77441 | Fulshear | Fort Bend County | $2,179 | September 2026 |
| 77447 | Hockley | Harris County | $1,883 | September 2026 |
| 77449 | Katy | Harris County | $1,809 | September 2026 |
| 77450 | Katy | Harris County | $1,763 | September 2026 |
| 77459 | Missouri City | Fort Bend County | $2,266 | September 2026 |
| 77469 | Rosenberg | Fort Bend County | $1,994 | September 2026 |
| 77471 | Rosenberg | Fort Bend County | $1,612 | September 2026 |
| 77477 | Stafford | Fort Bend County | $1,534 | September 2026 |
| 77478 | Sugar Land | Fort Bend County | $1,872 | September 2026 |
| 77479 | Sugar Land | Fort Bend County | $2,130 | September 2026 |
| 77484 | Waller | Harris County | $1,614 | September 2026 |
| 77489 | Missouri City | Fort Bend County | $1,898 | September 2026 |
| 77493 | Katy | Harris County | $2,197 | September 2026 |
| 77494 | Katy | Fort Bend County | $1,861 | September 2026 |
| 77498 | Sugar Land | Fort Bend County | $1,830 | September 2026 |
| 77502 | Pasadena | Harris County | $1,615 | September 2026 |
| 77503 | Pasadena | Harris County | $1,290 | September 2026 |
| 77504 | Pasadena | Harris County | $1,251 | September 2026 |
| 77505 | Pasadena | Harris County | $1,429 | September 2026 |
| 77506 | Pasadena | Harris County | $1,331 | September 2026 |
| 77511 | Alvin | Brazoria County | $1,758 | September 2026 |
| 77515 | Angleton | Brazoria County | $1,546 | September 2026 |
| 77520 | Baytown | Harris County | $1,190 | September 2026 |
| 77521 | Baytown | Harris County | $1,547 | September 2026 |
| 77523 | Baytown | Chambers County | $2,035 | September 2026 |
| 77530 | Channelview | Harris County | $1,789 | September 2026 |
| 77531 | Clute | Brazoria County | $891 | September 2026 |
| 77532 | Crosby | Harris County | $1,891 | September 2026 |
| 77535 | Dayton | Liberty County | $1,599 | September 2026 |
| 77536 | Deer Park | Harris County | $1,945 | September 2026 |
| 77539 | Dickinson | Galveston County | $1,679 | September 2026 |
| 77541 | Freeport | Brazoria County | $1,383 | September 2026 |
| 77545 | Fresno | Fort Bend County | $2,159 | September 2026 |
| 77546 | Friendswood | Galveston County | $2,118 | September 2026 |
| 77547 | Galena Park | Harris County | $1,650 | September 2026 |
| 77550 | Galveston | Galveston County | $1,509 | September 2026 |
| 77551 | Galveston | Galveston County | $1,246 | September 2026 |
| 77554 | Galveston | Galveston County | $2,559 | September 2026 |
| 77563 | Hitchcock | Galveston County | $1,521 | September 2026 |
| 77565 | Kemah | Galveston County | $1,496 | September 2026 |
| 77566 | Lake Jackson | Brazoria County | $1,402 | September 2026 |
| 77568 | La Marque | Galveston County | $2,008 | September 2026 |
| 77571 | La Porte | Harris County | $1,640 | September 2026 |
| 77573 | League City | Galveston County | $1,744 | September 2026 |
| 77575 | Liberty | Liberty County | $1,988 | September 2026 |
| 77578 | Manvel | Brazoria County | $2,007 | September 2026 |
| 77581 | Pearland | Brazoria County | $1,861 | September 2026 |
| 77583 | Iowa Colony | Brazoria County | $2,324 | September 2026 |
| 77584 | Pearland | Brazoria County | $1,905 | September 2026 |
| 77586 | El Lago | Harris County | $1,696 | September 2026 |
| 77590 | Texas City | Galveston County | $1,136 | September 2026 |
| 77591 | Texas City | Galveston County | $1,688 | September 2026 |
| 77598 | Webster | Harris County | $1,360 | September 2026 |
| 77627 | Nederland | Jefferson County | $1,332 | September 2026 |
| 77630 | Orange | Orange County | $1,239 | September 2026 |
| 77632 | Orange | Orange County | $1,100 | September 2026 |
| 77640 | Port Arthur | Jefferson County | $1,400 | September 2026 |
| 77642 | Port Arthur | Jefferson County | $1,151 | September 2026 |
| 77651 | Port Neches | Jefferson County | $1,474 | September 2026 |
| 77657 | Lumberton | Hardin County | $1,978 | September 2026 |
| 77662 | Vidor | Orange County | $1,430 | September 2026 |
| 77701 | Beaumont | Jefferson County | $931 | September 2026 |
| 77703 | Beaumont | Jefferson County | $1,237 | September 2026 |
| 77705 | Beaumont | Jefferson County | $1,063 | September 2026 |
| 77706 | Beaumont | Jefferson County | $1,419 | September 2026 |
| 77707 | Beaumont | Jefferson County | $1,686 | September 2026 |
| 77713 | Beaumont | Jefferson County | $1,367 | September 2026 |
| 77801 | Bryan | Brazos County | $1,306 | September 2026 |
| 77802 | Bryan | Brazos County | $1,414 | September 2026 |
| 77803 | Bryan | Brazos County | $1,555 | September 2026 |
| 77807 | Bryan | Brazos County | $1,522 | September 2026 |
| 77833 | Brenham | Washington County | $1,596 | September 2026 |
| 77840 | College Station | Brazos County | $1,848 | September 2026 |
| 77845 | College Station | Brazos County | $1,613 | September 2026 |
| 77901 | Victoria | Victoria County | $1,087 | September 2026 |
| 77904 | Victoria | Victoria County | $1,393 | September 2026 |
| 78003 | Bandera | Bandera County | $750 | September 2026 |
| 78006 | Boerne | Kendall County | $1,338 | September 2026 |
| 78015 | Fair Oaks Ranch | Bexar County | $1,771 | September 2026 |
| 78023 | Helotes | Bexar County | $2,019 | September 2026 |
| 78028 | Kerrville | Kerr County | $1,877 | September 2026 |
| 78040 | Laredo | Webb County | $800 | September 2026 |
| 78041 | Laredo | Webb County | $1,100 | September 2026 |
| 78043 | Laredo | Webb County | $1,021 | September 2026 |
| 78045 | Laredo | Webb County | $1,381 | September 2026 |
| 78046 | Laredo | Webb County | $1,086 | September 2026 |
| 78063 | Pipe Creek | Bandera County | $1,546 | September 2026 |
| 78064 | Pleasanton | Atascosa County | $1,212 | September 2026 |
| 78070 | Spring Branch | Comal County | $1,781 | September 2026 |
| 78073 | San Antonio | Bexar County | $1,726 | September 2026 |
| 78102 | Beeville | Bee County | $1,038 | September 2026 |
| 78108 | Cibolo | Guadalupe County | $1,737 | September 2026 |
| 78109 | Converse | Bexar County | $1,659 | September 2026 |
| 78114 | Floresville | Wilson County | $1,333 | September 2026 |
| 78130 | New Braunfels | Comal County | $1,568 | September 2026 |
| 78132 | New Braunfels | Comal County | $1,586 | September 2026 |
| 78133 | Canyon Lake | Comal County | $1,738 | September 2026 |
| 78148 | Universal City | Bexar County | $1,163 | September 2026 |
| 78152 | Saint Hedwig | Bexar County | $1,807 | September 2026 |
| 78154 | Schertz | Guadalupe County | $1,550 | September 2026 |
| 78155 | Seguin | Guadalupe County | $1,429 | September 2026 |
| 78163 | Bulverde | Comal County | $2,330 | September 2026 |
| 78201 | San Antonio | Bexar County | $1,042 | September 2026 |
| 78202 | San Antonio | Bexar County | $1,355 | September 2026 |
| 78203 | San Antonio | Bexar County | $1,669 | September 2026 |
| 78204 | San Antonio | Bexar County | $1,352 | September 2026 |
| 78205 | San Antonio | Bexar County | $2,016 | September 2026 |
| 78207 | San Antonio | Bexar County | $1,317 | September 2026 |
| 78208 | San Antonio | Bexar County | $1,678 | September 2026 |
| 78209 | San Antonio | Bexar County | $1,539 | September 2026 |
| 78210 | San Antonio | Bexar County | $1,341 | September 2026 |
| 78211 | San Antonio | Bexar County | $1,389 | September 2026 |
| 78212 | San Antonio | Bexar County | $1,437 | September 2026 |
| 78213 | Castle Hills | Bexar County | $1,074 | September 2026 |
| 78214 | San Antonio | Bexar County | $964 | September 2026 |
| 78215 | San Antonio | Bexar County | $1,635 | September 2026 |
| 78216 | San Antonio | Bexar County | $1,233 | September 2026 |
| 78217 | San Antonio | Bexar County | $1,147 | September 2026 |
| 78218 | San Antonio | Bexar County | $1,453 | September 2026 |
| 78219 | San Antonio | Bexar County | $1,340 | September 2026 |
| 78220 | San Antonio | Bexar County | $1,512 | September 2026 |
| 78221 | San Antonio | Bexar County | $1,236 | September 2026 |
| 78222 | San Antonio | Bexar County | $1,651 | September 2026 |
| 78223 | San Antonio | Bexar County | $1,267 | September 2026 |
| 78224 | San Antonio | Bexar County | $1,632 | September 2026 |
| 78225 | San Antonio | Bexar County | $1,350 | September 2026 |
| 78227 | San Antonio | Bexar County | $1,363 | September 2026 |
| 78228 | San Antonio | Bexar County | $1,152 | September 2026 |
| 78229 | San Antonio | Bexar County | $1,049 | September 2026 |
| 78230 | San Antonio | Bexar County | $1,115 | September 2026 |
| 78231 | Shavano Park | Bexar County | $1,130 | September 2026 |
| 78232 | San Antonio | Bexar County | $1,291 | September 2026 |
| 78233 | San Antonio | Bexar County | $1,317 | September 2026 |
| 78235 | San Antonio | Bexar County | $1,132 | September 2026 |
| 78237 | San Antonio | Bexar County | $1,216 | September 2026 |
| 78238 | San Antonio | Bexar County | $1,308 | September 2026 |
| 78239 | San Antonio | Bexar County | $1,493 | September 2026 |
| 78240 | San Antonio | Bexar County | $1,256 | September 2026 |
| 78242 | San Antonio | Bexar County | $1,459 | September 2026 |
| 78244 | San Antonio | Bexar County | $1,545 | September 2026 |
| 78245 | San Antonio | Bexar County | $1,484 | September 2026 |
| 78247 | San Antonio | Bexar County | $1,547 | September 2026 |
| 78248 | San Antonio | Bexar County | $1,237 | September 2026 |
| 78249 | San Antonio | Bexar County | $1,393 | September 2026 |
| 78250 | San Antonio | Bexar County | $1,491 | September 2026 |
| 78251 | San Antonio | Bexar County | $1,233 | September 2026 |
| 78252 | San Antonio | Bexar County | $1,740 | September 2026 |
| 78253 | San Antonio | Bexar County | $1,592 | September 2026 |
| 78254 | San Antonio | Bexar County | $1,801 | September 2026 |
| 78255 | San Antonio | Bexar County | $1,932 | September 2026 |
| 78256 | San Antonio | Bexar County | $1,571 | September 2026 |
| 78257 | San Antonio | Bexar County | $1,365 | September 2026 |
| 78258 | San Antonio | Bexar County | $1,478 | September 2026 |
| 78259 | San Antonio | Bexar County | $1,464 | September 2026 |
| 78260 | San Antonio | Bexar County | $1,539 | September 2026 |
| 78261 | San Antonio | Bexar County | $1,768 | September 2026 |
| 78362 | Ingleside | San Patricio County | $1,344 | September 2026 |
| 78363 | Kingsville | Kleberg County | $1,506 | September 2026 |
| 78374 | Portland | San Patricio County | $1,574 | September 2026 |
| 78380 | Robstown | Nueces County | $935 | September 2026 |
| 78382 | Rockport | Aransas County | $1,161 | September 2026 |
| 78401 | Corpus Christi | Nueces County | $1,180 | September 2026 |
| 78404 | Corpus Christi | Nueces County | $1,247 | September 2026 |
| 78408 | Corpus Christi | Nueces County | $1,133 | September 2026 |
| 78410 | Corpus Christi | Nueces County | $1,504 | September 2026 |
| 78411 | Corpus Christi | Nueces County | $1,654 | September 2026 |
| 78412 | Corpus Christi | Nueces County | $1,402 | September 2026 |
| 78413 | Corpus Christi | Nueces County | $1,284 | September 2026 |
| 78414 | Corpus Christi | Nueces County | $1,530 | September 2026 |
| 78415 | Corpus Christi | Nueces County | $1,428 | September 2026 |
| 78418 | Corpus Christi | Nueces County | $1,833 | September 2026 |
| 78501 | McAllen | Hidalgo County | $1,183 | September 2026 |
| 78503 | McAllen | Hidalgo County | $1,251 | September 2026 |
| 78504 | McAllen | Hidalgo County | $1,684 | September 2026 |
| 78516 | Alamo | Hidalgo County | $1,331 | September 2026 |
| 78520 | Brownsville | Cameron County | $1,521 | September 2026 |
| 78521 | Brownsville | Cameron County | $1,609 | September 2026 |
| 78526 | Brownsville | Cameron County | $1,897 | September 2026 |
| 78539 | Edinburg | Hidalgo County | $1,147 | September 2026 |
| 78541 | Edinburg | Hidalgo County | $994 | September 2026 |
| 78542 | Edinburg | Hidalgo County | $1,119 | September 2026 |
| 78550 | Harlingen | Cameron County | $1,134 | September 2026 |
| 78552 | Harlingen | Cameron County | $1,254 | September 2026 |
| 78570 | Mercedes | Hidalgo County | $818 | September 2026 |
| 78572 | Mission | Hidalgo County | $1,327 | September 2026 |
| 78573 | Alton | Hidalgo County | $1,071 | September 2026 |
| 78574 | La Homa | Hidalgo County | $1,592 | September 2026 |
| 78575 | Rancho Viejo | Cameron County | $1,656 | September 2026 |
| 78577 | Pharr | Hidalgo County | $1,112 | September 2026 |
| 78578 | Port Isabel | Cameron County | $1,993 | September 2026 |
| 78596 | Weslaco | Hidalgo County | $1,127 | September 2026 |
| 78597 | South Padre Island | Cameron County | $2,758 | September 2026 |
| 78599 | Weslaco | Hidalgo County | $1,109 | September 2026 |
| 78602 | Bastrop | Bastrop County | $1,723 | September 2026 |
| 78610 | Buda | Hays County | $1,560 | September 2026 |
| 78613 | Cedar Park | Williamson County | $1,588 | September 2026 |
| 78617 | Del Valle | Travis County | $1,624 | September 2026 |
| 78620 | Dripping Springs | Hays County | $2,088 | September 2026 |
| 78621 | Elgin | Bastrop County | $1,791 | September 2026 |
| 78624 | Fredericksburg | Gillespie County | $1,900 | September 2026 |
| 78626 | Georgetown | Williamson County | $1,579 | September 2026 |
| 78628 | Georgetown | Williamson County | $1,680 | September 2026 |
| 78633 | Georgetown | Williamson County | $1,684 | September 2026 |
| 78634 | Hutto | Williamson County | $1,723 | September 2026 |
| 78640 | Kyle | Hays County | $1,585 | September 2026 |
| 78641 | Leander | Williamson County | $1,872 | September 2026 |
| 78642 | Liberty Hill | Williamson County | $2,281 | September 2026 |
| 78644 | Lockhart | Caldwell County | $1,712 | September 2026 |
| 78645 | Lago Vista | Travis County | $1,953 | September 2026 |
| 78653 | Manor | Travis County | $1,640 | September 2026 |
| 78654 | Marble Falls | Burnet County | $1,572 | September 2026 |
| 78656 | Maxwell | Caldwell County | $1,847 | September 2026 |
| 78657 | Horseshoe Bay | Llano County | $1,418 | September 2026 |
| 78660 | Pflugerville | Travis County | $1,600 | September 2026 |
| 78664 | Round Rock | Williamson County | $1,643 | September 2026 |
| 78665 | Round Rock | Williamson County | $1,691 | September 2026 |
| 78666 | San Marcos | Hays County | $1,418 | September 2026 |
| 78669 | Spicewood | Travis County | $3,572 | September 2026 |
| 78676 | Wimberley | Hays County | $2,099 | September 2026 |
| 78681 | Round Rock | Williamson County | $1,771 | September 2026 |
| 78701 | Austin | Travis County | $3,177 | September 2026 |
| 78702 | Austin | Travis County | $2,103 | September 2026 |
| 78703 | Austin | Travis County | $2,392 | September 2026 |
| 78704 | Austin | Travis County | $1,920 | September 2026 |
| 78705 | Austin | Travis County | $1,972 | September 2026 |
| 78717 | Austin | Williamson County | $1,634 | September 2026 |
| 78721 | Austin | Travis County | $1,782 | September 2026 |
| 78722 | Austin | Travis County | $1,726 | September 2026 |
| 78723 | Austin | Travis County | $1,900 | September 2026 |
| 78724 | Austin | Travis County | $1,581 | September 2026 |
| 78725 | Austin | Travis County | $2,002 | September 2026 |
| 78726 | Austin | Travis County | $1,377 | September 2026 |
| 78727 | Austin | Travis County | $1,427 | September 2026 |
| 78728 | Austin | Travis County | $1,279 | September 2026 |
| 78729 | Austin | Williamson County | $1,266 | September 2026 |
| 78730 | Austin | Travis County | $1,614 | September 2026 |
| 78731 | Austin | Travis County | $1,594 | September 2026 |
| 78732 | Austin | Travis County | $2,047 | September 2026 |
| 78733 | Austin | Travis County | $2,983 | September 2026 |
| 78734 | Austin | Travis County | $2,787 | September 2026 |
| 78735 | Austin | Travis County | $1,667 | September 2026 |
| 78736 | Austin | Travis County | $1,438 | September 2026 |
| 78737 | Austin | Hays County | $1,843 | September 2026 |
| 78738 | Austin | Travis County | $2,373 | September 2026 |
| 78739 | Austin | Travis County | $3,440 | September 2026 |
| 78741 | Austin | Travis County | $1,367 | September 2026 |
| 78744 | Austin | Travis County | $1,419 | September 2026 |
| 78745 | Austin | Travis County | $1,497 | September 2026 |
| 78746 | West Lake Hills | Travis County | $1,921 | September 2026 |
| 78747 | Austin | Travis County | $1,640 | September 2026 |
| 78748 | Austin | Travis County | $1,425 | September 2026 |
| 78749 | Austin | Travis County | $1,608 | September 2026 |
| 78750 | Austin | Travis County | $1,489 | September 2026 |
| 78751 | Austin | Travis County | $1,749 | September 2026 |
| 78752 | Austin | Travis County | $1,421 | September 2026 |
| 78753 | Austin | Travis County | $1,272 | September 2026 |
| 78754 | Austin | Travis County | $1,416 | September 2026 |
| 78756 | Austin | Travis County | $1,654 | September 2026 |
| 78757 | Austin | Travis County | $1,848 | September 2026 |
| 78758 | Austin | Travis County | $1,501 | September 2026 |
| 78759 | Austin | Travis County | $1,392 | September 2026 |
| 78840 | Del Rio | Val Verde County | $1,346 | September 2026 |
| 78852 | Eagle Pass | Maverick County | $1,156 | September 2026 |
| 79015 | Canyon | Randall County | $1,232 | September 2026 |
| 79102 | Amarillo | Potter County | $1,349 | September 2026 |
| 79103 | Amarillo | Potter County | $1,550 | September 2026 |
| 79106 | Amarillo | Potter County | $1,086 | September 2026 |
| 79107 | Amarillo | Potter County | $1,089 | September 2026 |
| 79109 | Amarillo | Randall County | $1,135 | September 2026 |
| 79110 | Amarillo | Randall County | $1,506 | September 2026 |
| 79118 | Amarillo | Randall County | $1,763 | September 2026 |
| 79119 | Amarillo | Randall County | $1,769 | September 2026 |
| 79364 | Slaton | Lubbock County | $820 | September 2026 |
| 79382 | Wolfforth | Lubbock County | $1,564 | September 2026 |
| 79401 | Lubbock | Lubbock County | $805 | September 2026 |
| 79403 | Lubbock | Lubbock County | $1,129 | September 2026 |
| 79404 | Lubbock | Lubbock County | $1,227 | September 2026 |
| 79407 | Lubbock | Lubbock County | $1,497 | September 2026 |
| 79410 | Lubbock | Lubbock County | $1,210 | September 2026 |
| 79411 | Lubbock | Lubbock County | $924 | September 2026 |
| 79412 | Lubbock | Lubbock County | $937 | September 2026 |
| 79413 | Lubbock | Lubbock County | $1,308 | September 2026 |
| 79414 | Lubbock | Lubbock County | $1,064 | September 2026 |
| 79415 | Lubbock | Lubbock County | $889 | September 2026 |
| 79416 | Lubbock | Lubbock County | $1,460 | September 2026 |
| 79423 | Lubbock | Lubbock County | $1,348 | September 2026 |
| 79424 | Lubbock | Lubbock County | $1,596 | September 2026 |
| 79601 | Abilene | Taylor County | $2,044 | September 2026 |
| 79602 | Abilene | Taylor County | $2,276 | September 2026 |
| 79603 | Abilene | Taylor County | $1,868 | September 2026 |
| 79605 | Abilene | Taylor County | $1,677 | September 2026 |
| 79606 | Abilene | Taylor County | $2,154 | September 2026 |
| 79701 | Midland | Midland County | $1,552 | September 2026 |
| 79703 | Midland | Midland County | $1,381 | September 2026 |
| 79705 | Midland | Midland County | $1,655 | September 2026 |
| 79706 | Midland | Midland County | $1,784 | September 2026 |
| 79707 | Midland | Midland County | $1,473 | September 2026 |
| 79720 | Big Spring | Howard County | $1,452 | September 2026 |
| 79761 | Odessa | Ector County | $1,311 | September 2026 |
| 79762 | Odessa | Ector County | $1,471 | September 2026 |
| 79763 | Odessa | Ector County | $1,725 | September 2026 |
| 79765 | Odessa | Ector County | $1,823 | September 2026 |
| 79830 | Alpine | Brewster County | $1,300 | September 2026 |
| 79902 | El Paso | El Paso County | $1,149 | September 2026 |
| 79903 | El Paso | El Paso County | $1,143 | September 2026 |
| 79904 | El Paso | El Paso County | $1,161 | September 2026 |
| 79905 | El Paso | El Paso County | $1,205 | September 2026 |
| 79907 | El Paso | El Paso County | $1,288 | September 2026 |
| 79912 | El Paso | El Paso County | $1,554 | September 2026 |
| 79915 | El Paso | El Paso County | $1,254 | September 2026 |
| 79924 | El Paso | El Paso County | $1,331 | September 2026 |
| 79925 | El Paso | El Paso County | $1,326 | September 2026 |
| 79927 | Socorro | El Paso County | $1,660 | September 2026 |
| 79928 | El Paso | El Paso County | $1,808 | September 2026 |
| 79930 | El Paso | El Paso County | $1,296 | September 2026 |
| 79932 | El Paso | El Paso County | $1,804 | September 2026 |
| 79934 | El Paso | El Paso County | $1,803 | September 2026 |
| 79935 | El Paso | El Paso County | $1,152 | September 2026 |
| 79936 | El Paso | El Paso County | $1,440 | September 2026 |
| 79938 | El Paso | El Paso County | $1,747 | September 2026 |
For a bedroom-specific voucher reference, use the HUD rent lookup. FMR/SAFMR gross rents, adopted payment standards and a unit’s approved contract rent are different measures; do not substitute them for bedroom-specific asking rents.
A free month lowers the average, not every payment
A quoted rent can look cheaper after concessions while still requiring more cash in the first month. Compare the written lease term, concession timing, recurring charges and deposit together. Ask whether a renewal loses the concession and which costs continue during the free month.
- $18,70011 paid rent months
- + $2,410$180 × 12 in extras + $250 one-time fee
- $1,759/month$21,110 ÷ 12, rounded
Original hypothetical arithmetic. A $1,700 refundable deposit is separate. A full-rent month costs $1,880; conservative first-month cash is $3,830 when all fees and the deposit are due together.
Price an actual Texas lease offer
Hypothetical inputs, not a market quote. This assumes free months waive base rent only; monthly extras continue. Deposits stay separate from lease cost. Inputs are not saved.
- Average monthly lease cost
- $1,759
- Full-rent month cash
- $1,880
- Total lease cost, deposit excluded
- $21,110
- Conservative first-month cash
- $3,830
First-month cash assumes the full rent, monthly extras, all one-time fees and deposit are due together. Your actual due dates and concession month may differ; request the payment schedule.
Formula: [rent × (lease months − free months) + monthly extras × lease months + one-time fees] ÷ lease months. Refundable deposit is cash tied up, not an assumed expense.
Get the utility arrangement before comparing offers
Ask which utilities are individually metered, submetered, allocated by the property or included in rent. Request the written billing method and actual available bills; use a seasonal allowance you can defend instead of treating a mild month as the annual norm. Texas’s PUC water and sewer submetering/allocation resources identify the relevant billing subject. For electricity plan terms and service availability, start with the PUC’s Power to Choose; provider choice depends on the address.
Turn the benchmark into a property decision
- Match the home. Compare current offers with the same bedroom count, floor area, home type, condition, lease term and included services. A county’s all-size index cannot price a one-bedroom apartment or detached house.
- Match the destination. Houston-area and DFW counties cover many trip patterns. Price your actual commute, parking and tolls separately. Use TxDOT’s DriveTexas for road conditions when planning a viewing; this page supplies no commute estimate.
- Match cash timing. Keep the first month, deposit and nonrefundable fees separate. Enter written concession terms in the worksheet; do not assume the advertised monthly equivalent is the amount due.
- Check the property and lease. Ask about water intrusion, cooling performance, required insurance and responsibility for utilities. Start with the Texas Attorney General’s renter resources for repair and tenancy questions; this guide does not determine a lawful rent or legal remedy.
Can this show one-bedroom rents or rent growth?
The shared page loader supplies a latest eligible all-size index for each ZIP. It does not supply a compatible bedroom series or matched historical series for these county sets. Bedroom rents, rent per square foot and growth percentages are therefore withheld. A difference between two locations is not growth over time.
For an investment, put a unit-matched rent and a downside case into the rental cash-flow calculator; the Texas county market directory adds broader context. For your own household, continue with the Texas rent-versus-buy comparisons. Those tasks need costs beyond rent.
Read-only freshness audit, October 20, 2026: the shared database’s 752 eligible state ZIPs matched the upstream September 2026 observation month. No upstream ZIP was missing from storage and no matched stored observation lagged the source. Storage also held 77 older June–August observations outside the current sample; 77 stored ZIPs were absent from the downloaded file. These are dated audit counts, not a promise of future coverage. The lookup’s displayed dates and counts follow the shared validated refresh. Quarterly apartment research elsewhere on this page uses its own named sources, periods and cohorts.
Sources, dates and limits
Zillow Research supplies ZIP-level smoothed all-home ZORI. Its repeat-rent methodology describes weighting within the index. RentalCalcs’ equal-ZIP aggregation is an additional calculation; it is not population-weighted or a survey of occupied leases.
- September 2026: 752 eligible ZIP observations.
0 included observations have unknown dates. Values come from the shared paginated rent loader, including its publication eligibility filter, retry handling and central cache invalidation. Historical rows remain for provenance; this page neither refreshes nor overrides rents independently.
Tracked ZIPs are not all Texas ZIPs, homes or listings. Housing mix and coverage affect comparisons; positive extremes are retained rather than silently trimmed. Concessions, utilities and deposits are not encoded as an actual lease offer. No household savings, vacancy, future growth or investment return is predicted.
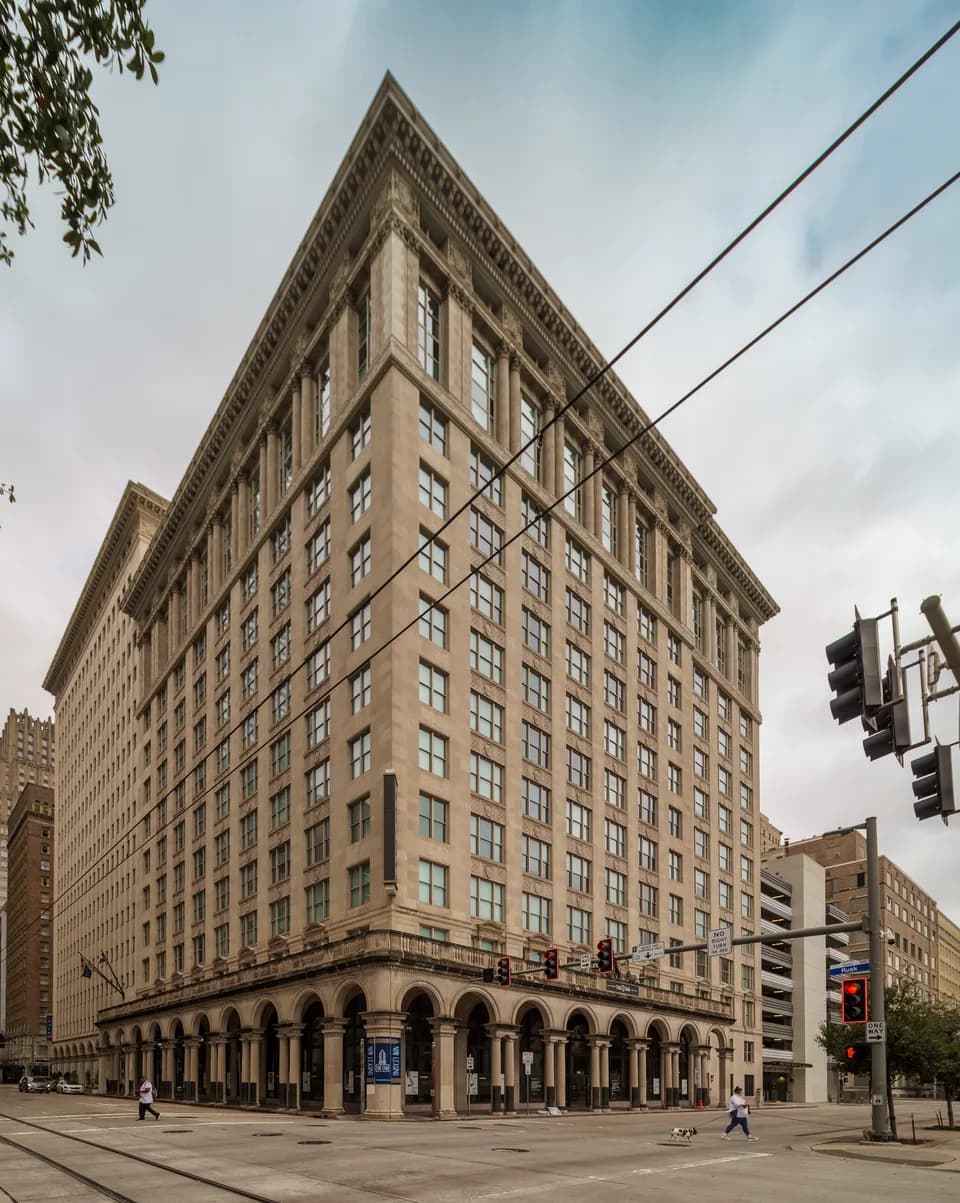
Photography documents a named Houston building in 2024. Its credit, license and resize note appear with the image. The county table uses shared data; the lease-cost diagram and worksheet use labeled hypothetical inputs. These visuals do not imply available inventory.
Content and usability reviewed : Texas market theses, primary-source research, investor income stress, body photography and retained city/ZIP lookup. Automated data publication does not advance this editorial date. About RentalCalcs · Report a data issue.