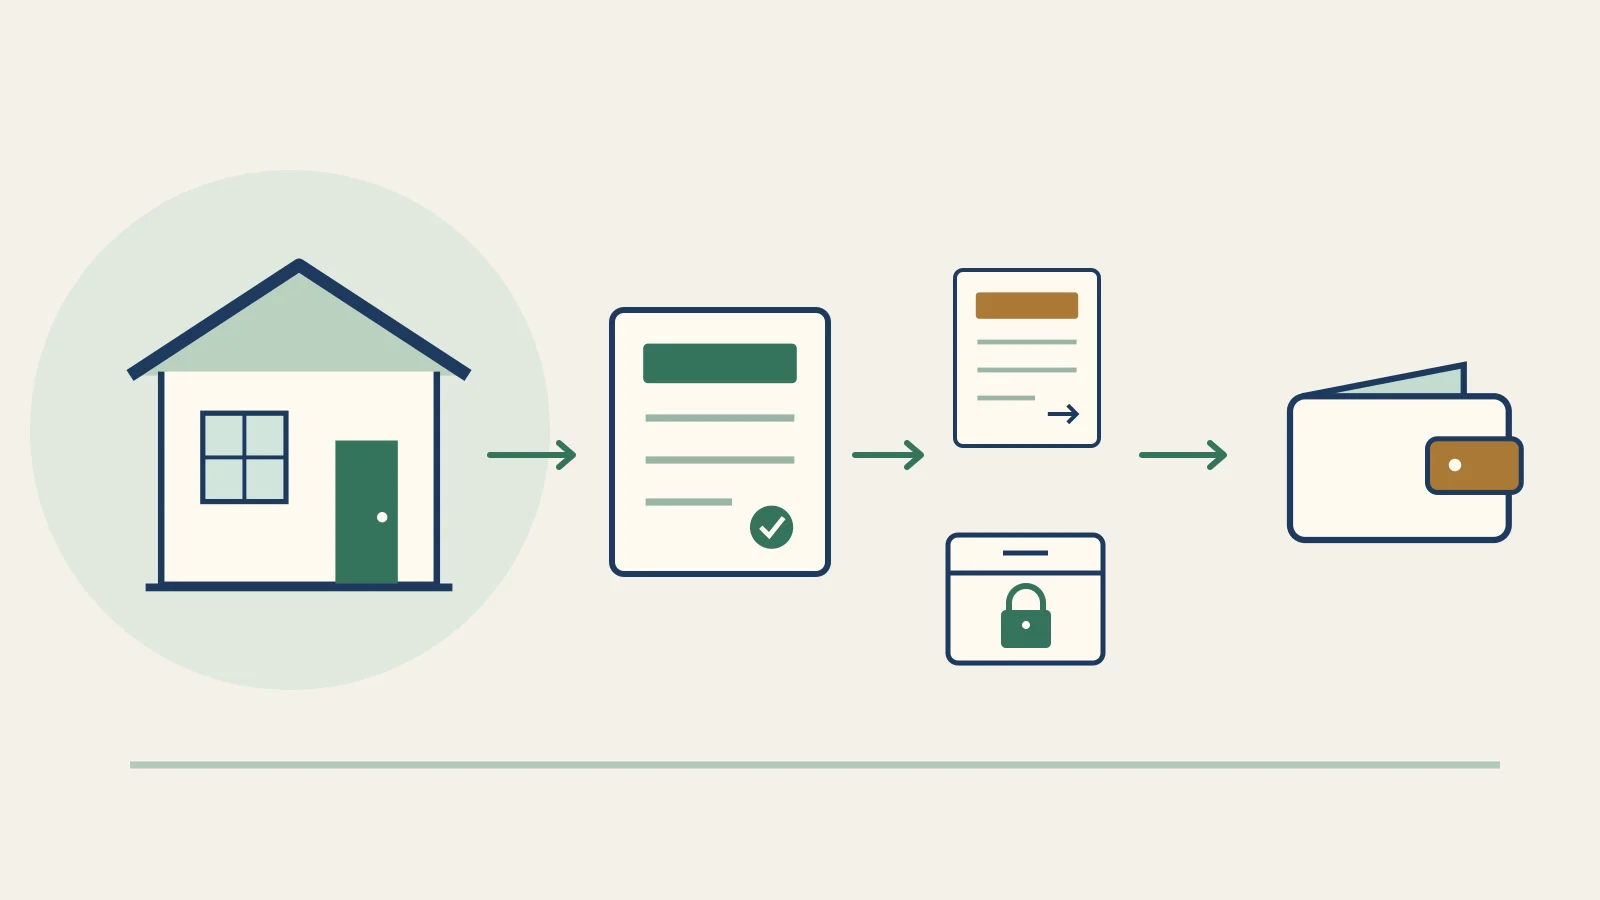
A good cap rate needs support from comparable properties and verified operating costs. It must also leave an acceptable cash margin after financing and replacements. In our worked example, a 7% cap rate leaves only $31 a year after debt and capital reserves.
That does not make every 7% property unattractive. It means the percentage cannot answer the buying question by itself. Start with a consistent definition of income, compare the right properties, then calculate the money left under your loan and expense assumptions.
What a cap rate is, and what it is good for
Cap rate = annual net operating income ÷ property price or value. State which price you use: asking price, negotiated acquisition price or current estimated value. A change in the denominator changes the result even if the building earns exactly the same income.
Net operating income, or NOI, means effective property income after vacancy and credit loss, less operating costs. In this guide, operations include taxes, insurance, routine repairs, management and other owner-paid running costs. NOI excludes loan payments, depreciation, income taxes and capital replacements. We budget replacements separately below NOI. Some lenders and reports use different reserve conventions; reconcile them before comparing percentages. The NOI guide explains the line items.
Cap rate helps compare property income before financing. It does not measure total return, appreciation or spendable owner cash. Even an all-cash buyer still needs to fund replacements, transaction costs and any taxes outside the NOI calculation.
J.P. Morgan's cap-rate explanation, dated February 2, 2026, emphasizes matching property characteristics and actual versus projected income. That is the useful discipline: a seller's hoped-for stabilized income is not equivalent to a nearby building's collected income.
How it works · illustrated
The hypothetical $250,000 rental produces $30,000 of scheduled annual rent. Follow the deductions before comparing its yield with the money you can spend.
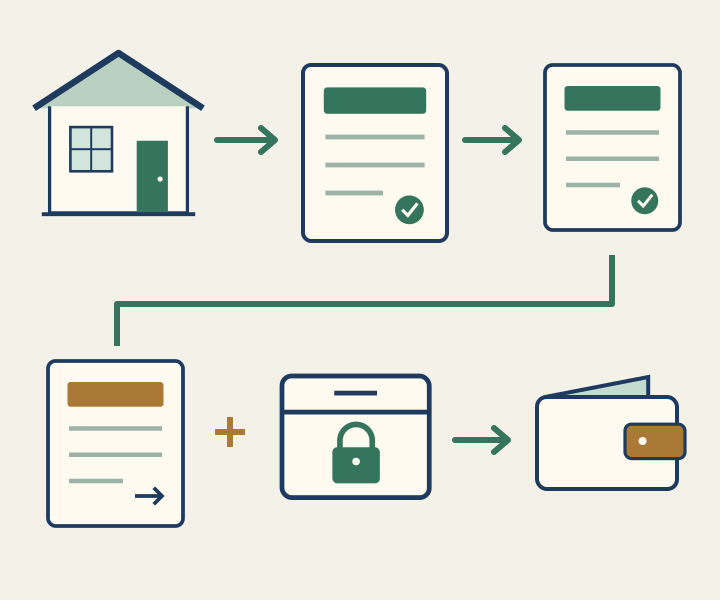
- Before vacancy and expenses
- 12% gross
$30,000 scheduled rent divided by the $250,000 price.
- After vacancy and operations
- 7% cap
$17,500 annual NOI divided by the same price; financing is excluded.
- After debt and replacements
- $31 a year
About $3 a month remains after $14,969 of loan payments and a $2,500 reserve contribution.
The gross yield and cap rate use price as the denominator. The final figure is dollars of cash, before income taxes; it is not another percentage return.
Original RentalCalcs illustration · Reviewed October 14, 2026. Conceptual artwork, not a monetary scale. The article supplies the full hypothetical budget.
The honest answer: there is no universally good cap rate
“Is a 5%, 7% or 8% cap rate good?” needs two separate answers. Is the price supported by comparable property income? And does the resulting cash meet your criteria? A fairly priced building can fail your cash target. A cheap building can need repairs that its advertised yield does not reveal.
Use local evidence for the first question. Match location, unit count and mix, condition, leases, occupancy, expense responsibilities, valuation date and NOI period. Distinguish an asking cap from a completed sale. A higher cap can reflect more income, a lower price, an omitted expense or a risk the market discounts; the number alone cannot tell you which.
For the second question, write down your required annual cash, available reserves and acceptable downside. Those are buyer assumptions, not market statistics. Someone pursuing current income may reject a property that another buyer accepts for a different objective. Neither choice removes the need to fund its costs.
The cash-flow versus appreciation guide develops that tradeoff. The market-ranking methodology explains why a fixed expense allowance can make rent-to-price and modeled cap-rate rankings repeat the same signal. Expected appreciation is a scenario to test, not money available to cover next month's shortfall.
The cap rate framework that actually matters
Review a proposed cap rate in four passes:
- Normalize the income. Identify the period, leases, concessions, collections and vacancy treatment. Separate existing income from proposed rent increases.
- Rebuild operations for the buyer. Verify the tax treatment after purchase, obtain an insurance quote and include management even if you also model doing the work yourself.
- Translate NOI into cash. Subtract full principal-and-interest payments and a distinct capital replacement allowance. Define the cash invested before quoting cash-on-cash return.
- Change one decision-driving assumption. Test a documented cost increase, weaker collections or a different price. Record whether the result changes your decision.
Keep the supporting documents beside your rental property pro forma. If an expense has no quote or record, label it an estimate and identify the evidence still needed. A precise percentage built from uncertain inputs remains uncertain.
Gross is not net, and net is what pays your mortgage
Consider a hypothetical $250,000 rental at $2,500 a month. It starts stabilized, with no initial rent-free opening period. The figures are educational assumptions, not a listing, local cost estimate or loan quote. Dollar results are rounded from unrounded calculations.
Preview: 3 of 9 rows
| Annual operating budget | Amount | Assumption |
|---|---|---|
| Scheduled rent | $30,000 | $2,500 for 12 months |
| Vacancy and credit loss | -$1,500 | 5% of scheduled rent |
| Effective income | $28,500 | No other income assumed |
| Property taxes | -$4,500 | Illustrative buyer's budget |
| Insurance | -$1,800 | Illustrative annual premium |
| Routine repairs | -$1,600 | Separate from capital replacements |
| Management | -$2,280 | 8% of collected income |
| Other owner-paid operations | -$820 | Combined utilities, dues and other running costs |
| Net operating income | $17,500 | $28,500 less $11,000 operations |
Scheduled rent divided by price gives a 12% gross yield. NOI divided by price gives a 7% cap rate. Neither deducts the loan payment. Our $2,500 annual replacement contribution comes next, below NOI, so it is not counted twice.
Now suppose the buyer puts 25% down and borrows $187,500 at an illustrative 7% fixed rate, amortized monthly over 30 years. Principal and interest total $14,969 a year, about $1,247 a month. Taxes and insurance are already in operating costs; do not subtract them again through an escrow-inclusive mortgage payment.
Annual cash after reserve = $17,500 NOI - $14,969 debt service - $2,500 replacement contribution = about $31. That is roughly $3 a month before income taxes. Principal repayment may build equity, but it is not cash available to spend.
For cash-on-cash, this example commits $85,000: $62,500 down, $7,500 transaction costs and prepaids including inspection, $5,000 initial work and $10,000 retained liquidity. No other acquisition or opening costs are assumed. Add them if the actual property requires them. The annual $2,500 contribution replenishes future replacement funding; it is distinct from the $10,000 held at acquisition.
Using that stated denominator, $31 divided by $85,000 is less than 0.1% annual cash-on-cash after reserve. Other definitions exclude retained cash or use a different numerator, so disclose the convention when comparing returns. See the cash-on-cash return guide for a fuller reconciliation.
The worked decision · Annual dollars
Five hypothetical income cases, the same $250,000 price and financing. Only NOI changes. Each bar measures annual cash after the full loan payment and replacement contribution.
5% cap rate-$4,969
$12,500 NOI · Cash shortfall, before income taxes.
6% cap rate-$2,469
$15,000 NOI · Cash shortfall, before income taxes.
7% cap rate+$31
$17,500 NOI · Cash remaining, before income taxes.
8% cap rate+$2,531
$20,000 NOI · Cash remaining, before income taxes.
9% cap rate+$5,031
$22,500 NOI · Cash remaining, before income taxes.
Shared scale: −$5,500 to +$5,500, with zero at the center. Left is a shortfall; right is cash remaining. The $31 bar is intentionally tiny. Exact values are shown as text; color is not needed.
Original RentalCalcs calculations · Reviewed October 14, 2026. Assumptions: 25% down, 7% fixed interest, 30-year monthly amortization, $14,969 annual principal and interest, $2,500 annual replacement reserve. Rates are illustrative, not quotes. Calculations use unrounded payments.
Open the cap-rate comparison worksheetThe spread over your borrowing cost
Comparing cap rate only with the loan's interest rate misses principal repayment on an amortizing loan. The mortgage constant is annual principal and interest divided by the original loan amount. In this example it is approximately 7.98%, even though the interest rate is 7%.
That comparison helps explain leverage, but it is not a universal buy-or-pass rule. In a simplified model with no acquisition costs or replacement contribution, a cap rate above the mortgage constant increases the current cash yield on the down payment relative to the unlevered cap rate.
Actual reserves, fees, loan structure and cash invested change the owner result. A cap below the constant can still produce positive dollars of cash; it simply does not establish an attractive return.
Use the actual payment schedule instead of a shortcut. An interest-only period, balloon, adjustable rate or shorter amortization needs its own scenario. Do not assume a refinance will be available to fix a weak initial budget.
For the fixed-price example, you can solve directly for an income requirement:
Required cap rate = (annual debt service + annual replacement contribution + annual cash target) ÷ price.
With the same $250,000 price and loan, approximately 7.0% covers the modeled payments and reserve with almost nothing left. To retain $250 a month, the required NOI rises to about $20,469, or 8.2% of price.
These are rounded thresholds for this specific budget, not recommended cap rates for the market. The chart changes NOI at a fixed price; cutting the purchase price is a different calculation because it can also reduce the loan.
For example, holding NOI at $17,500, a 6% income yield implies a price of about $291,667; 7% implies $250,000; and 8% implies $218,750. With 25% down, the same loan terms and the same $2,500 annual reserve, those prices leave approximately -$2,464, +$31 and +$1,902 of annual cash respectively. This is conditional income math, not an appraisal or an offer recommendation. Closing cash and costs can change with price too.
Also check the loan's actual DSCR definition. A lender's coverage calculation and required ratio may differ from this article's owner cash budget; approval does not establish that your cash target is met.
What is a good cap rate for multifamily?
For multifamily, compare a property with similar buildings and the same income basis. A stabilized apartment building, a partly vacant renovation and an owner-occupied duplex solve different investment problems. One broad “multifamily cap rate” range hides those differences.
Distinguish three calculations:
| Measure | Numerator | Denominator |
|---|---|---|
| Going-in cap rate | Defined current or first-year NOI | Acquisition price |
| Stabilized cap on purchase price | Forecast stabilized NOI | Acquisition price |
| Stabilized yield on cost | Forecast stabilized NOI | Acquisition plus the stated improvement and other project costs |
Name every included cost. A forecast stabilized yield is not earned income, and the difference from today's cap rate is not a profit margin. Renovation spending, downtime, financing and execution risk sit between the two. Use the multifamily analysis guide to connect the rent roll to that transition.
The CBRE U.S. Cap Rate Survey H1 2026, published August 12, reports professional estimates informed by trades and market discussions across more than 50 markets. Its value-add definition uses stabilized NOI over acquisition price plus value-add capital.
Read that denominator before comparing it with a listing's cap rate on price alone. The public summary does not establish a universal target for a small rental; detailed property and market coverage must match your comparison.
Exit assumptions deserve a separate stress test. At a hypothetical $100,000 NOI, a 5% exit cap implies $2 million of gross asset value. At 5.5% it implies about $1.82 million, roughly 9.1% less, before selling costs, debt payoff and taxes.
Those rates illustrate sensitivity; neither is a forecast or a required stress increment. Pair the exit-rate test with a credible NOI downside rather than relying on appreciation to rescue the purchase.
How to calibrate "good" for your market
Build a short comparison file with the address or submarket, property type, sale date, price, NOI period, reserve convention and source. Ask a broker or appraiser what the reported number includes. “Seller pro forma” belongs in a different column from verified operating records.
Use rent comparables to support the income and verify the seller's rent roll. Match lease terms, utilities and concessions. For expenses, check the local assessor's rules for a transfer and any exemptions rather than assuming the seller's bill carries forward. Get property-specific coverage and deductible terms; the insurance cost guide explains why a headline premium is incomplete.
Suppose that verification adds $1,000 of insurance and $500 of owner-paid utilities to our example. NOI falls to $16,000, the cap rate to 6.4%, and annual cash after the same debt and reserve to approximately -$1,469, or -$122 a month. Nothing about the advertised rent or purchase price changed. Two missing costs reversed the cash result.
Area rent and price statistics can help choose where to research. Dividing a city's median rent by its median sale price does not produce a property-level cap rate: the homes are not necessarily matched, and operating expenses are missing. Use the market directory as a starting point, then return to the property's evidence.
Common cap rate mistakes
- Calling gross rent a cap rate. Deduct vacancy and operations first, and state the NOI period.
- Using future rent as current income. Label the proposed increase and account for concessions, turnover and the time needed to achieve it.
- Dropping management because you self-manage. Show both cases and recognize the labor commitment; compare buildings on the same basis.
- Counting reserves twice, or omitting them entirely. State the benchmark convention, then show the owner's replacement budget explicitly.
- Comparing cap rate with interest alone. Use full scheduled loan payments and a clearly defined cash-investment denominator.
- Treating a high number as proof of value. Investigate deferred work, lease quality, taxes, insurance and legal use before treating the price as a bargain.
Where to find real cap rate data
Start with dated research from firms that disclose their methodology, then obtain recent comparable transactions and property records for the actual segment. Record whether each figure is a professional estimate, a listing calculation or a verified sale calculation. The distinction matters more than adding another decimal place.
The public CBRE survey and J.P. Morgan explanation linked above provide context and comparison discipline. They are not substitutes for a specific small property's income and expense evidence. We have not reproduced gated market tables or inferred neighborhood ranges from national commentary.
For your own record, use the cap-rate comparison worksheet. It captures the benchmark definition, operating budget, financing, reserve, cash target and the assumption most likely to change the decision. Entries stay in the current browser page and are not automatically saved; print or save your completed copy.
The takeaway
Rebuild the income and expense case in the single-family analyzer, or use the multifamily analyzer for a multi-unit property. Reconcile the tool's output with the separately stated replacement budget and cash commitment in your worksheet. A model can expose the assumptions; it cannot verify leases, condition or a lender's terms for you.
The practical answer to “what is a good cap rate?” is a comparison you can defend and a cash result you can fund. Keep both on the page before deciding whether to proceed.
Get new articles and market updates
Investing guides and market data, straight to your inbox. Unsubscribe anytime.
