Section 8 Rent Limits in Indiana for FY2027: Fair Market Rent for Every County
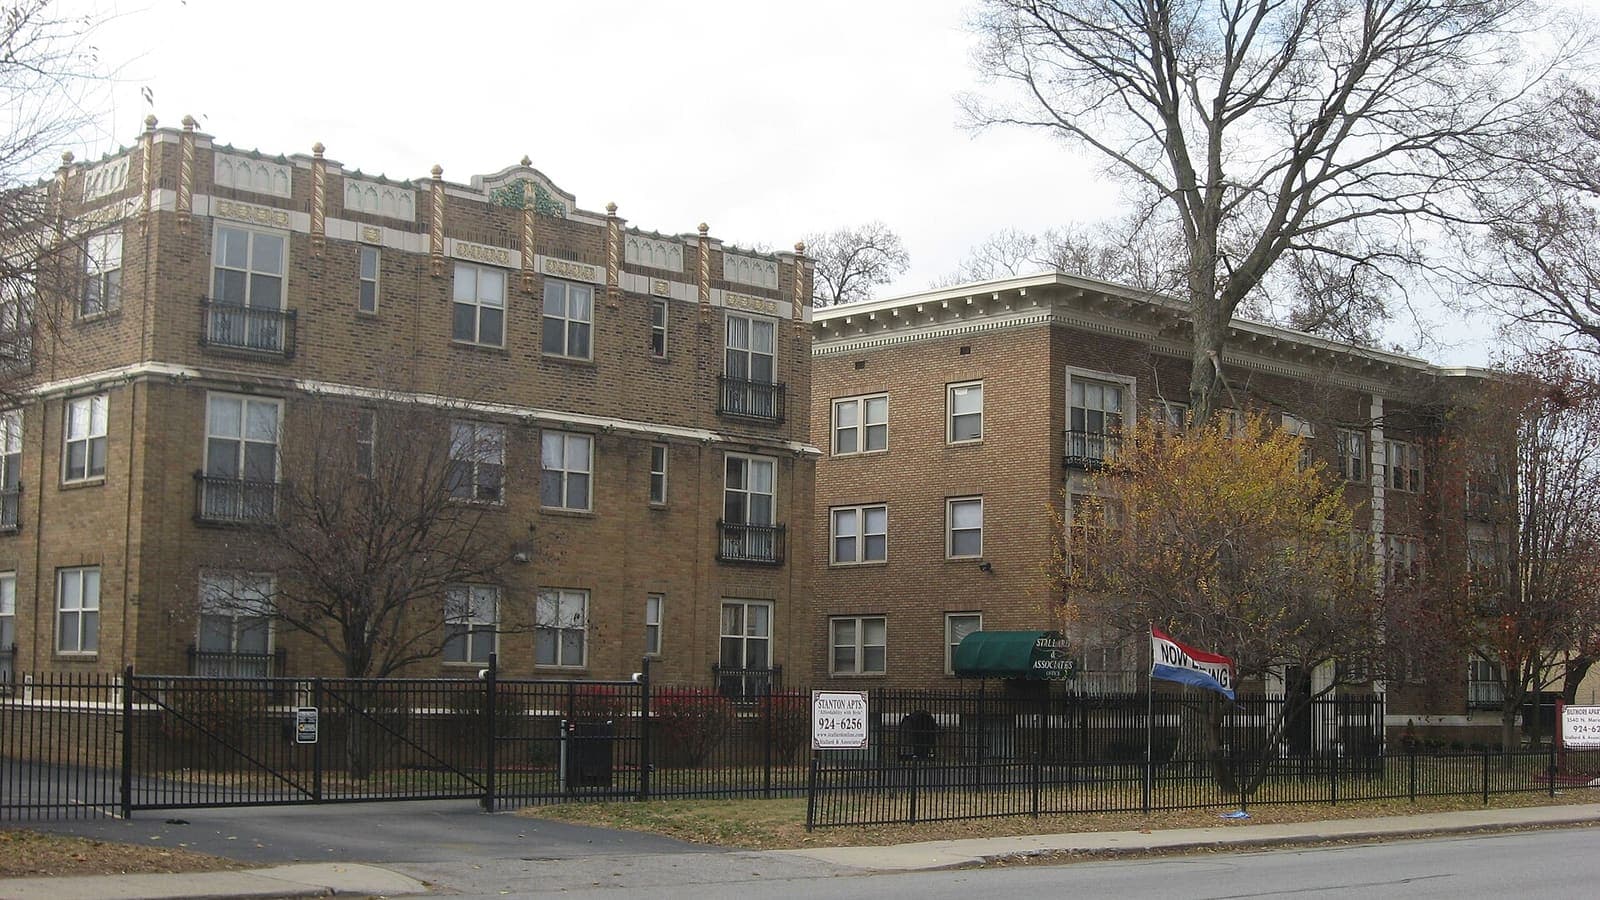

Every county in Indiana has its own Section 8 rent ceiling, and the full FY2027 list is below. HUD's FY2027 Fair Market Rents are effective October 1, 2026; the 2-bedroom figure is as low as $1,014 in Adams County and as high as $1,536 in Shelby County, with the median county at $1,083. Housing authorities set their payment standards within 90% to 110% of these numbers.
Compared with FY2026, the 2-bedroom figure rose in 91 counties and fell in 1. The largest increase was Jasper County ($1,174 to $1,349, +14.9%); the steepest cut was St. Joseph County ($1,292 to $1,276, -1.2%). Five metros in Indiana are on HUD's mandatory Small Area FMR list (Cincinnati, OH-KY-IN; Fort Wayne, IN; Gary, IN; Indianapolis-Carmel, IN; Louisville, KY-IN), where the limit is set ZIP code by ZIP code instead of by county; the county figure there is only an average.
Reading the table. These are HUD Fair Market Rents, the basis for payment standards, not the standards themselves. Each housing authority picks a point between 90% and 110% of the FMR for each bedroom size and publishes it as its payment standard. The voucher then pays the standard (or the actual gross rent, if lower) minus about 30% of your adjusted income. Utilities you pay yourself count against the ceiling through a utility allowance.
FY2027 Fair Market Rents by Metro Area in Indiana
HUD groups counties into FMR areas; a metro's figure applies to every county inside it. "ZIP-level" marks mandatory Small Area FMR metros.
| FMR area | Studio | 1 BR | 2 BR | 3 BR | 4 BR | 2 BR vs FY2026 |
|---|---|---|---|---|---|---|
| Anderson, IN | $1,011 | $1,017 | $1,331 | $1,743 | $1,749 | +10.4% |
| Bloomington, IN | $1,001 | $1,096 | $1,252 | $1,601 | $1,932 | +3.5% |
| Carroll County, IN | $760 | $787 | $1,027 | $1,232 | $1,396 | +5.5% |
| Cincinnati, OH-KY-IN (ZIP-level) | $1,052 | $1,128 | $1,442 | $1,897 | $2,141 | +6.6% |
| Columbus, IN | $1,261 | $1,276 | $1,493 | $1,779 | $2,126 | +5.5% |
| Elkhart-Goshen, IN | $1,008 | $1,048 | $1,253 | $1,653 | $1,752 | +5.9% |
| Evansville, IN | $866 | $872 | $1,127 | $1,387 | $1,534 | +1.3% |
| Fort Wayne, IN (ZIP-level) | $1,025 | $1,026 | $1,248 | $1,534 | $1,679 | +12.1% |
| Franklin County, IN | $841 | $950 | $1,148 | $1,503 | $1,509 | +2.8% |
| Gary, IN (ZIP-level) | $1,117 | $1,176 | $1,429 | $1,739 | $1,898 | +8.5% |
| Indianapolis-Carmel, IN (ZIP-level) | $1,187 | $1,336 | $1,536 | $1,991 | $2,425 | +4.3% |
| Jasper County, IN | $1,024 | $1,031 | $1,349 | $1,741 | $1,773 | +14.9% |
| Kokomo, IN | $909 | $915 | $1,179 | $1,420 | $1,636 | +5.0% |
| Lafayette-West Lafayette, IN | $942 | $1,070 | $1,273 | $1,517 | $2,128 | +2.5% |
| Louisville, KY-IN (ZIP-level) | $976 | $1,058 | $1,276 | $1,629 | $1,874 | +0.3% |
| Michigan City-La Porte, IN | $963 | $1,031 | $1,245 | $1,525 | $1,762 | +8.1% |
| Muncie, IN | $899 | $913 | $1,145 | $1,438 | $1,890 | +9.8% |
| Owen County, IN | $818 | $914 | $1,014 | $1,244 | $1,606 | +6.1% |
| South Bend-Mishawaka, IN | $937 | $1,093 | $1,276 | $1,545 | $1,677 | -1.2% |
| Sullivan County, IN | $810 | $816 | $1,067 | $1,370 | $1,783 | +3.8% |
| Terre Haute, IN | $890 | $896 | $1,164 | $1,387 | $1,610 | +6.4% |
| Tipton County, IN | $941 | $947 | $1,239 | $1,476 | $1,628 | +11.7% |
| Warren County, IN | $750 | $892 | $1,014 | $1,328 | $1,333 | +6.1% |
| Washington County, IN | $770 | $775 | $1,014 | $1,222 | $1,333 | +2.6% |
| Wells County, IN | $837 | $842 | $1,102 | $1,342 | $1,535 | +11.2% |
FY2027 Fair Market Rents for Every County in Indiana
All 92 counties, alphabetical. Studio figures are in the metro table above.
| County | 1 BR | 2 BR | 3 BR | 4 BR | 2 BR vs FY2026 |
|---|---|---|---|---|---|
| Adams County | $931 | $1,014 | $1,281 | $1,413 | +6.1% |
| Allen County | $1,026 | $1,248 | $1,534 | $1,679 | +12.1% |
| Bartholomew County | $1,276 | $1,493 | $1,779 | $2,126 | +5.5% |
| Benton County | $1,070 | $1,273 | $1,517 | $2,128 | +2.5% |
| Blackford County | $775 | $1,014 | $1,373 | $1,589 | +6.1% |
| Boone County | $1,336 | $1,536 | $1,991 | $2,425 | +4.3% |
| Brown County | $1,336 | $1,536 | $1,991 | $2,425 | +4.3% |
| Carroll County | $787 | $1,027 | $1,232 | $1,396 | +5.5% |
| Cass County | $836 | $1,014 | $1,350 | $1,355 | +6.1% |
| Clark County | $1,058 | $1,276 | $1,629 | $1,874 | +0.3% |
| Clay County | $896 | $1,164 | $1,387 | $1,610 | +6.4% |
| Clinton County | $855 | $1,063 | $1,416 | $1,445 | +5.6% |
| Crawford County | $834 | $1,014 | $1,404 | $1,479 | +6.1% |
| Daviess County | $833 | $1,090 | $1,336 | $1,433 | +8.7% |
| Dearborn County | $1,128 | $1,442 | $1,897 | $2,141 | +6.6% |
| Decatur County | $850 | $1,112 | $1,325 | $1,461 | +3.8% |
| DeKalb County | $814 | $1,023 | $1,270 | $1,344 | +6.6% |
| Delaware County | $913 | $1,145 | $1,438 | $1,890 | +9.8% |
| Dubois County | $775 | $1,014 | $1,351 | $1,695 | +6.1% |
| Elkhart County | $1,048 | $1,253 | $1,653 | $1,752 | +5.9% |
| Fayette County | $843 | $1,014 | $1,261 | $1,350 | +6.1% |
| Floyd County | $1,058 | $1,276 | $1,629 | $1,874 | +0.3% |
| Fountain County | $775 | $1,014 | $1,279 | $1,695 | +6.1% |
| Franklin County | $950 | $1,148 | $1,503 | $1,509 | +2.8% |
| Fulton County | $790 | $1,034 | $1,232 | $1,359 | +7.5% |
| Gibson County | $828 | $1,083 | $1,364 | $1,524 | +8.2% |
| Grant County | $804 | $1,014 | $1,329 | $1,488 | +6.1% |
| Greene County | $775 | $1,014 | $1,266 | $1,533 | +6.1% |
| Hamilton County | $1,336 | $1,536 | $1,991 | $2,425 | +4.3% |
| Hancock County | $1,336 | $1,536 | $1,991 | $2,425 | +4.3% |
| Harrison County | $1,058 | $1,276 | $1,629 | $1,874 | +0.3% |
| Hendricks County | $1,336 | $1,536 | $1,991 | $2,425 | +4.3% |
| Henry County | $810 | $1,014 | $1,208 | $1,333 | +6.1% |
| Howard County | $915 | $1,179 | $1,420 | $1,636 | +5.0% |
| Huntington County | $781 | $1,014 | $1,311 | $1,634 | +6.1% |
| Jackson County | $873 | $1,142 | $1,445 | $1,507 | +7.8% |
| Jasper County | $1,031 | $1,349 | $1,741 | $1,773 | +14.9% |
| Jay County | $775 | $1,014 | $1,328 | $1,333 | +6.1% |
| Jefferson County | $862 | $1,041 | $1,313 | $1,636 | +7.2% |
| Jennings County | $795 | $1,040 | $1,385 | $1,411 | +8.2% |
| Johnson County | $1,336 | $1,536 | $1,991 | $2,425 | +4.3% |
| Knox County | $775 | $1,014 | $1,332 | $1,333 | +6.1% |
| Kosciusko County | $888 | $1,162 | $1,410 | $1,527 | +1.8% |
| LaGrange County | $794 | $1,039 | $1,238 | $1,366 | +6.3% |
| Lake County | $1,176 | $1,429 | $1,739 | $1,898 | +8.5% |
| LaPorte County | $1,031 | $1,245 | $1,525 | $1,762 | +8.1% |
| Lawrence County | $784 | $1,026 | $1,222 | $1,572 | +7.3% |
| Madison County | $1,017 | $1,331 | $1,743 | $1,749 | +10.4% |
| Marion County | $1,336 | $1,536 | $1,991 | $2,425 | +4.3% |
| Marshall County | $877 | $1,088 | $1,296 | $1,430 | +7.9% |
| Martin County | $775 | $1,014 | $1,208 | $1,536 | +6.1% |
| Miami County | $827 | $1,014 | $1,208 | $1,412 | +6.1% |
| Monroe County | $1,096 | $1,252 | $1,601 | $1,932 | +3.5% |
| Montgomery County | $900 | $1,046 | $1,351 | $1,459 | +8.3% |
| Morgan County | $1,336 | $1,536 | $1,991 | $2,425 | +4.3% |
| Newton County | $1,176 | $1,429 | $1,739 | $1,898 | +8.5% |
| Noble County | $782 | $1,023 | $1,219 | $1,710 | +5.8% |
| Ohio County | $1,128 | $1,442 | $1,897 | $2,141 | +6.6% |
| Orange County | $826 | $1,014 | $1,378 | $1,637 | +6.1% |
| Owen County | $914 | $1,014 | $1,244 | $1,606 | +6.1% |
| Parke County | $775 | $1,014 | $1,328 | $1,333 | +5.2% |
| Perry County | $775 | $1,014 | $1,259 | $1,695 | +6.1% |
| Pike County | $775 | $1,014 | $1,404 | $1,429 | +6.1% |
| Porter County | $1,176 | $1,429 | $1,739 | $1,898 | +8.5% |
| Posey County | $872 | $1,127 | $1,387 | $1,534 | +1.3% |
| Pulaski County | $893 | $1,014 | $1,404 | $1,695 | +6.1% |
| Putnam County | $905 | $1,056 | $1,462 | $1,742 | +2.5% |
| Randolph County | $931 | $1,014 | $1,328 | $1,333 | +6.1% |
| Ripley County | $805 | $1,053 | $1,363 | $1,384 | +6.7% |
| Rush County | $786 | $1,014 | $1,208 | $1,333 | +6.1% |
| Scott County | $800 | $1,047 | $1,341 | $1,400 | +3.8% |
| Shelby County | $1,336 | $1,536 | $1,991 | $2,425 | +4.3% |
| Spencer County | $775 | $1,014 | $1,351 | $1,356 | +6.1% |
| St. Joseph County | $1,093 | $1,276 | $1,545 | $1,677 | -1.2% |
| Starke County | $775 | $1,014 | $1,244 | $1,579 | +6.1% |
| Steuben County | $842 | $1,102 | $1,415 | $1,448 | +6.4% |
| Sullivan County | $816 | $1,067 | $1,370 | $1,783 | +3.8% |
| Switzerland County | $787 | $1,029 | $1,246 | $1,376 | +7.6% |
| Tippecanoe County | $1,070 | $1,273 | $1,517 | $2,128 | +2.5% |
| Tipton County | $947 | $1,239 | $1,476 | $1,628 | +11.7% |
| Union County | $775 | $1,014 | $1,248 | $1,356 | +6.1% |
| Vanderburgh County | $872 | $1,127 | $1,387 | $1,534 | +1.3% |
| Vermillion County | $896 | $1,164 | $1,387 | $1,610 | +6.4% |
| Vigo County | $896 | $1,164 | $1,387 | $1,610 | +6.4% |
| Wabash County | $775 | $1,014 | $1,208 | $1,348 | +6.1% |
| Warren County | $892 | $1,014 | $1,328 | $1,333 | +6.1% |
| Warrick County | $872 | $1,127 | $1,387 | $1,534 | +1.3% |
| Washington County | $775 | $1,014 | $1,222 | $1,333 | +2.6% |
| Wayne County | $775 | $1,014 | $1,281 | $1,333 | +6.1% |
| Wells County | $842 | $1,102 | $1,342 | $1,535 | +11.2% |
| White County | $867 | $1,134 | $1,351 | $1,490 | +10.1% |
| Whitley County | $1,026 | $1,248 | $1,534 | $1,679 | +12.1% |
Where the Limit Moved Most From FY2026 to FY2027
Biggest increases (2-bedroom):
| County | FY2026 | FY2027 | Change |
|---|---|---|---|
| Jasper County | $1,174 | $1,349 | +14.9% |
| Allen County | $1,113 | $1,248 | +12.1% |
| Whitley County | $1,113 | $1,248 | +12.1% |
| Tipton County | $1,109 | $1,239 | +11.7% |
| Wells County | $991 | $1,102 | +11.2% |
Biggest cuts (2-bedroom):
| County | FY2026 | FY2027 | Change |
|---|---|---|---|
| St. Joseph County | $1,292 | $1,276 | -1.2% |
Two rules soften these swings: HUD will not let an FMR fall more than 10% in a year, and a housing authority can hold its payment standard anywhere up to 110% of the new figure. A cut shows up first in new leases and rent-increase requests, not in a lease already signed.
Where a Voucher Beats the Market in Indiana
Comparing HUD's 2-bedroom limit to Zillow's observed rent in the same ZIP code shows where a voucher actually stretches. In Indiana, Indianapolis-Carmel-Anderson is the friendliest metro: the median ZIP's limit is +4.5% against market rent and 57% of its ZIPs have a limit above the going rent. Chicago-Naperville-Elgin is the hardest at -13.3%. "Median premium" is the typical ZIP's rent limit minus market rent, as a percent of market rent.
| Metro | ZIPs with data | Median premium | ZIPs above market |
|---|---|---|---|
| Indianapolis-Carmel-Anderson, IN | 68 | +4.5% | 57% |
| Fort Wayne, IN | 16 | -8.3% | 31% |
| Chicago-Naperville-Elgin, IL-IN-WI | 25 | -13.3% | 16% |
Landlords in the positive-premium metros are leaving money on the table by turning away vouchers; the authority's rent reasonableness check still applies, so you will be approved at market, not above it. The national ranking is in our voucher-vs-market analysis.
The Largest Housing Authorities in Indiana
The largest voucher programs in Indiana, by vouchers administered. Each publishes its own payment standard table, usually a one-page PDF under its Housing Choice Voucher section:
- Indianapolis Housing Agency (Indianapolis), about 9,000 vouchers, (317) 261-7200
- Indiana Housing and Community Development Au (Indianapolis), about 6,700 vouchers, (317) 232-7788
- Fort Wayne Housing Authority (Fort Wayne), about 3,400 vouchers, (260) 267-9300
- Housing Authority of the City of Evansville (Evansville), about 2,900 vouchers, (812) 428-8500
- Housing Authority of the City of Gary Indiana (Gary), about 2,500 vouchers, (219) 881-6422
- Housing Authority of South Bend (South Bend), about 2,500 vouchers, (574) 235-9346
- Housing Authority of the City of Bloomington (Bloomington), about 1,700 vouchers, (812) 339-3491
- Housing Authority of the City of Lafayette (Lafayette), about 1,400 vouchers, (765) 771-1300
Can a Landlord Refuse a Voucher in Indiana?
Yes, in most of the state. Indiana law blocks cities and counties from requiring landlords to accept vouchers (Ind. Code §36-1-3-8.5 (2015)), so acceptance is voluntary and any local ordinance to the contrary is void.
Frequently Asked Questions
How much does Section 8 pay in Indiana? It depends on the county. HUD's FY2027 2-bedroom Fair Market Rent runs from $1,014 in Adams County to $1,536 in Shelby County, with a median county of $1,083. Your housing authority's payment standard is 90% to 110% of the figure for your county, and the voucher pays that standard minus about 30% of your adjusted income.
Which Indiana county has the highest Section 8 rent limit? Shelby County, at $1,536 for a 2-bedroom ($1,991 for a 3-bedroom) in FY2027. The lowest is Adams County at $1,014.
Did Section 8 rent limits go up in Indiana for FY2027? Mostly yes: the 2-bedroom figure rose in 91 counties, fell in 1, and held in 0. The biggest increase was Jasper County (+14.9%). The biggest cut was St. Joseph County (-1.2%).
Can a landlord refuse Section 8 in Indiana? Yes, in most of the state. Indiana law blocks cities and counties from requiring landlords to accept vouchers (Ind. Code §36-1-3-8.5 (2015)), so acceptance is voluntary and any local ordinance to the contrary is void.
Where is my housing authority's actual payment standard? On the authority's website, usually a one-page PDF updated each fall, or by calling its Housing Choice Voucher office. The largest Indiana authorities are listed above with phone numbers.
See also our Indiana Section 8 overview; metro guides for Indianapolis; the national 2-bedroom table for the 40 largest metros; HUD's FY2027 FMR dataset.
Holding a voucher in Indiana? Browse voucher-friendly listings by ZIP code and bedroom size.
Indiana landlord? List your property free. The table above is what a voucher tenant's authority can pay.
Stay Updated on Housing
Get the latest on fair market rents, voucher programs, and finding housing.
No spam, ever. Unsubscribe anytime.
VoucherMatch Editorial Team
Every rule, date and dollar amount in this article is checked against the agency document it comes from, and the sources are listed above. How VoucherMatch articles are researched and corrected
Find apartments
Listings on VoucherMatch come from landlords who say up front which vouchers they accept.
Related Articles
Section 8 Rent Limits in Maryland for FY2027: Fair Market Rent for Every County
HUD's FY2027 2-bedroom rent limit in Maryland runs from $1,014 (Allegany County) to $2,438 (Prince George's County), median $1,860. Every county's figure by bedroom size, what changed from FY2026, the largest housing authorities, and the voucher law.
9 min readSection 8 Rent Limits in Washington for FY2027: Fair Market Rent for Every County
HUD's FY2027 2-bedroom rent limit in Washington runs from $1,058 (Ferry County) to $2,549 (Snohomish County), median $1,467. Every county's figure by bedroom size, what changed from FY2026, the largest housing authorities, and the voucher law.
10 min readSection 8 Rent Limits in Colorado for FY2027: Fair Market Rent for Every County
HUD's FY2027 2-bedroom rent limit in Colorado runs from $1,014 (Baca County) to $2,766 (Summit County), median $1,344. Every county's figure by bedroom size, what changed from FY2026, the largest housing authorities, and the voucher law.
11 min readSection 8 Rent Limits in Virginia for FY2027: Fair Market Rent for Every County
HUD's FY2027 2-bedroom rent limit in Virginia runs from $943 (Alleghany County) to $2,438 (Stafford County), median $1,262. Every county's figure by bedroom size, what changed from FY2026, the largest housing authorities, and the voucher law.
17 min readSection 8 Rent Limits in Illinois for FY2027: Fair Market Rent for Every County
HUD's FY2027 2-bedroom rent limit in Illinois runs from $930 (Carroll County) to $2,341 (Kendall County), median $956. Every county's figure by bedroom size, what changed from FY2026, the largest housing authorities, and the voucher law.
15 min readSection 8 Rent Limits in Pennsylvania for FY2027: Fair Market Rent for Every County
HUD's FY2027 2-bedroom rent limit in Pennsylvania runs from $1,014 (Bedford County) to $1,860 (Philadelphia County), median $1,136. Every county's figure by bedroom size, what changed from FY2026, the largest housing authorities, and the voucher law.
13 min readFind Your Next Home
Explore section 8 apartments and local rental guidance.